Machine Learning‑Based Analysis of Breast Cancer Data from University of Calabar Teaching Hospital Patients
-
Abam Ayeni Omini


Department of Statistics, Federal University of Lafia, Lafia, Nigeria
Diala leona ConcordDepartment of Mathematics, Margaret Lawrence University, Abuja, Nigeria
| Received 29 Oct, 2025 |
Accepted 20 Jan, 2026 |
Published 31 Mar, 2026 |
Background and Objective: Breast cancer remains a leading cause of morbidity among women, with early detection critical for improving outcomes. This study aimed to identify significant predictors of malignancy and evaluate the effectiveness of machine learning models in diagnostic classification using patient data from the University of Calabar Teaching Hospital. Materials and Methods: A retrospective analysis was conducted on 213 patients treated between January, 2019 and August 2024. Demographic and clinical variables, including age, menopause status, tumor size, invasive lymph nodes, metastasis, breast quadrant, personal/family history of breast disease, and diagnosis outcome, were collected. Descriptive statistics, density plots, and inferential tests (Chi-square, t-test, ANOVA) were performed to examine differences between benign and malignant cases. A random forest classifier was trained to predict malignancy, and feature importance was analyzed to determine key contributors to model performance. Results: Of the patients analyzed, 117 had benign, and 90 had malignant diagnoses, with peak incidence in the 45-55 year age range. Tumor size, lymph node involvement, and metastasis were right-skewed, indicating early-stage presentation for most patients; malignant tumors were larger and occurred in older women. Significant differences were observed between benign and malignant groups in age, tumor size, metastasis, and lymph node involvement (p<0.05). Menopause status was significantly associated with tumor size. The Random Forest model achieved >90% accuracy and a kappa statistic of 84.54%, with tumor size, invasive nodes, metastasis, and age identified as the most important predictive features. Other variables, including breast quadrant, menopause status, and family history, contributed complementary diagnostic information. Conclusion: This study demonstrates that integrating classical statistical methods with machine learning can provide actionable insights for early breast cancer detection and risk stratification. Tumor size and lymph node status were reaffirmed as key clinical predictors. Limitations include missing values and data confined to a single institution. Future studies should use larger, multicenter datasets to enhance generalizability and refine predictive performance. Findings support the potential of data-driven models to assist in diagnostic decisions and personalized care pathways.
| Copyright © 2026 Omini and Concord. This is an open-access article distributed under the Creative Commons Attribution License, which permits unrestricted use, distribution, and reproduction in any medium, provided the original work is properly cited. |
INTRODUCTION
Breast cancer remains one of the most prevalent malignancies affecting women worldwide, accounting for a substantial proportion of cancer-related deaths and disabilities1. Early diagnosis plays a pivotal role in reducing mortality, as it enables timely intervention before the disease progresses to advanced stages2. Several risk factors have been identified, including age, genetic predisposition, hormonal status, menopausal transition, and family history3. Clinically, tumor size, lymph node involvement, and the presence of metastases are strongly correlated with disease severity and patient prognosis4.
Advancements in statistical methods and machine learning have provided enhanced capabilities for analyzing complex biomedical datasets. These methods facilitate the identification of critical diagnostic features and the development of predictive models that support clinical decision-making5,6. Ensemble algorithms such as Random Forest are particularly valuable in biomedical research due to their robustness, ability to handle multicollinearity, and capacity for feature ranking7.
Breast cancer is one of the most prevalent cancers and a major cause of cancer-related death for women in Nigeria and the world at large. Lack of early screening opportunities, low awareness, inadequate diagnostic infrastructure, and delays in seeking medical attention are the major reasons the disease is often discovered at severe stages in Nigeria. When compared to high-income nations, these characteristics result in a worse prognosis and greater death rates. There is limited locally collected data from Nigerian tertiary institutions regarding the relative predictive strength of these variables, despite the established clinical significance of factors like age, tumor size, lymph node involvement, metastasis, family history, and menopausal status in determining malignancy risk and disease progression.
The application of machine learning techniques, particularly ensemble methods such as Random Forest, has shown superior performance in predictive accuracy and feature ranking in other settings, yet such approaches remain underutilized in analyzing breast cancer data from Nigerian hospitals. There is a need to systematically evaluate the demographic and clinicopathological predictors of breast cancer malignancy by combining rigorous statistical testing with a robust machine learning framework to generate actionable insights that can inform clinical practice, guide resource allocation, and contribute to the reduction of breast cancer burden in the region.
The works of two scholars revealed that breast cancer is a great and formidable adversary in the landscape of global health challenges7,8. Some others believed that with breast cancer's intricate pathogenesis and diverse clinical manifestations, it poses significant obstacles to effective treatment and prevention9,10. However11, asserted that as the global incidence of this disease continues to rise, it is expedient to assess the different nature of breast cancer to develop effective therapeutic strategies.
Other researchers12 revealed that the cancer of the breast is seen as the highest existing malignant tumor affecting women worldwide. Patients who suffer from the cancer of the breast consist of about 36% of oncological patients9. The report published by the Global Cancer in 2020 revealed that there exists an approximate value of 2.089 million females diagnosed with breast cancer in 2018, implying that the illness is geometrically increasing, thereby causing threatening concerns13. This malignant tumor occurrence is increasing in all areas, continents, and geopolitical zones of the world, with a greater occurrence around the industrialized countries13. Almost half of the cases on a global scale are in developed countries14. This series and timely trend is mainly due to the so-called Western lifestyle, associated with a poor diet, nicotinic, excessive stress and little physical activity14. The work by Torre et al.15 posited that increasing breast cancer occurrence globally is a result of exponential population growth and the ageing of the population. Many of these occurrences are reported and recorded in developed countries14-16. This has happened or is continuously happening as a result of the so-called “Western lifestyle” or westernization. However, mortality and morbidity at high levels also occur in developing countries17. Researchers also
assert that the very essence of factors like late first birth, low number of babies born, use of hormone replacement therapy, obesity, lack of physical activity, or improper diet aids the conducive development of breast cancer growth15-17. This study leverages a breast cancer dataset from the University of Calabar Teaching Hospital, comprising 213 observations collected between January, 2019 and August, 2021. Variables include age at diagnosis, menopause status, tumor size, number of invasive lymph nodes, metastasis presence, family history of breast disease, and diagnosis result (benign or malignant). The objective is twofold: First, to identify statistically significant predictors of malignancy through classical statistical tests; and second, to evaluate the performance of a random forest model in classifying diagnostic outcomes. By integrating statistical analysis with machine learning, this study aims to contribute evidence-based insights for early detection, risk stratification, and enhanced diagnostic support in breast cancer care.
MATERIALS AND METHODS
Data source: A secondary dataset was obtained from the Kaggle website, containing medical records of female patients diagnosed and/or managed for breast lesions at the University of Calabar Teaching Hospital, Nigeria, between January, 2019 and August, 2024. The dataset included 213 patients with complete or near-complete information on the following variables: age, menopause status, tumor size, number of invasive lymph nodes, presence of metastasis, affected breast quadrant, breast side (left or right), history of breast disease, year of diagnosis, and final diagnosis.
The secondary, retrospective clinical dataset used in this study was derived from patient records at the University of Calabar Teaching Hospital and was acquired from the Kaggle website. The data includes variables like age at diagnosis, menopause status, tumor size, number of invasive lymph nodes, presence of metastasis, affected breast quadrant and side, personal/family history of breast disease, year of diagnosis, and final diagnosis (benign or malignant) for 213 female patients whose records date between January, 2019 and August, 2024.
Data pre-processing: To ensure suitability for statistical testing and machine learning modeling, missing values in the column’s year, tumor size, invasive lymph nodes, metastasis, and family history were identified and eliminated. All analyses were performed using R statistical software with packages including tidy verse, ggplot2, caret, and random forest.
All missing data from key clinical variables, such as the year of diagnosis, tumor size, number of invasive lymph nodes, metastatic status, and family history, were found and removed to ensure suitableness for statistical testing and machine learning modeling. R software version 4.4.2 was used to prepare the remaining dataset of 213 patients for analysis utilizing tools like tidy verse, ggplot2, caret, and random forest. This preprocessing made sure that a reliable and consistent dataset was used for the descriptive statistics, inferential tests, and model training processes that followed.
Descriptive analysis: Descriptive statistics such as mean, median, and standard deviation were used to summarize clinical and demographic features. Density plots were employed to visualize the distribution of continuous variables.
Measures such as mean, median, and standard deviation were utilized in the descriptive analysis to highlight significant variables. The distribution of continuous data, such as age, tumor size, invasive lymph nodes, and family history, was visualized using density plots. Benign and malign cases were compared in additional descriptive visualizations. These descriptive summaries influenced subsequent inferential and predictive modeling and provided early insights into differences between diagnostic groups.
Inferential analysis: In order to investigate correlations between clinical factors and breast cancer diagnosis, the inferential analysis in this study used a variety of statistical tests. Significant correlations
between these parameters and malignancy were found when chi-square tests were performed to evaluate relationships between categorical variables, including invasive lymph nodes, menopause status, family history, and diagnosis outcome. The mean values of continuous variables, such as age, tumor size, and metastasis, were compared between the benign and malignant groups using Welch’s two-sample t-tests. Also, the impact of menopause status on tumor size was assessed using a one-way ANOVA, which showed a strong and significant influence, with post-menopausal women often having larger tumors. Collectively, these inferential methods provided statistical evidence for identifying variables that differ significantly across diagnostic groups, supporting their clinical importance and suitability for predictive modeling.
Bivariate associations were assessed using: Chi-square test of independence for categorical variables, Welch’s two-sample t-test for comparing continuous variable means between benign and malignant groups, and One-way Analysis of Variance (ANOVA) to evaluate the impact of menopause status on tumor size Pairwise linear relationships between variables were examined using a correlation matrix.
Bivariate associations were assessed using the Chi-square test of independence for categorical variables, Welch’s two-sample t-test for comparing mean differences in continuous variables between benign and malignant groups, and one-way ANOVA to determine the effect of menopause status on tumor size. Pairwise linear relationships between variables were examined using a correlation matrix.
Machine learning modeling: A Random Forest classifier was trained to predict the binary diagnosis outcome (benign = 0, malignant = 1). Stratified sampling was applied to split the dataset into training (80%) and testing (20%) sets, maintaining the original class distribution.
Model performance was evaluated using:
| • | Overall accuracy | |
| • | Confusion matrix | |
| • | Kappa statistic | |
| • | Sensitivity and specificity | |
| • | Positive and negative predictive values |
Feature importance was assessed using the Mean Decrease in Gini Impurity, ranking each variable’s contribution to the predictive power of the model.
Study design: A retrospective analysis was conducted on 213 patients treated between January, 2019 and August, 2024. Demographic and clinical variables, including age, menopause status, tumor size, invasive lymph nodes, metastasis, breast quadrant, personal/family history of breast disease, and diagnosis outcome, were collected. Descriptive statistics, density plots, and inferential tests (Chi-square, t-test, ANOVA) were used to examine differences between benign and malignant cases. The random forest classifier was used to predict malignancy and identify key variables contributing to model performance.
RESULTS
Of the patients analyzed, 117 had benign, and 90 had malignant diagnoses, with peak incidence in the 45-55 year age range. Tumor size, lymph node involvement, and metastasis were right-skewed, indicating early-stage presentation for most patients; malignant tumors were larger and occurred in older women. Significant differences were observed between benign and malignant groups in age, tumor size, metastasis, and lymph node involvement (p<0.05). Menopause status was significantly associated with tumor size. The Random Forest model achieved >90% accuracy and a kappa statistic of 84.54%, with tumor size, invasive nodes, metastasis, and age identified as the most important predictive features. Other variables, including breast quadrant, menopause status, and family history, contributed complementary diagnostic information.
|
|
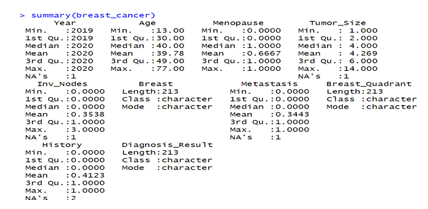
Figure 1 shows the summary statistics of the data. There are missing values in the year, tumor size, invasive nodes, metastasis, and history columns. The missing values were removed, so that the data is ready to work with.
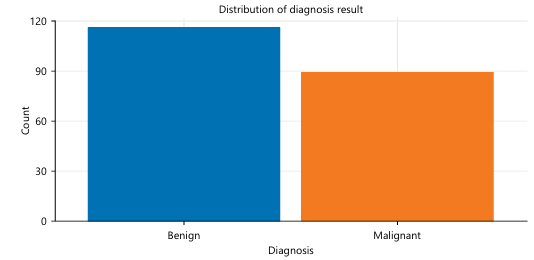
Figure 2 is the dataset showing the benign and malignant cases. This Fig. 2 reveals that there exists a greater number of benign cases (~117) than cancerous malignant ones (~90).
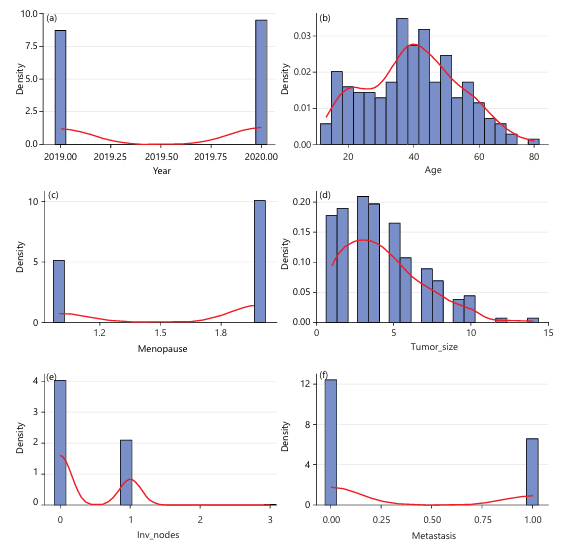
The histogram and density curve above are used to depict the distribution of the year variable in the data set. The years 2019 and 2020 are the two years in which the histogram bars show the occurrence of observations, and no data was recorded from 2021 to 2024, as shown in Fig. 3a. The peak at 2019 and 2020 of the density curve emphasizes this pattern. This suggests that the data were collected during two distinct periods. The graph reveals a bimodal and discontinuous distribution of the year variable.
This graph shows the distribution of patients’ ages using a histogram and a density curve. The histogram shows that patient ages range from the early teens to nearly 80. The largest concentration of the disease cases occurs between ages 30 and 55, as shown in Fig. 3b. The density curve highlights a slightly right-skewed pattern, meaning most patients fall within middle-aged groups (late 30s to early 40s), while fewer cases occur at older ages. The decrease in the number of older women (50 to 70+years) affected by this disease shows the decreasing frequency of cases in that age group, while the smaller bars at the youngest ages show that breast lesions are less common in very young individuals.
|
|
The graph shows the distribution of the menopause variable using a histogram and a density curve. The x-axis represents the menopause variable, where 1 represents pre-menopausal and 2 represents post-menopausal. The y-axis shows density instead of raw count, meaning the bars are scaled to represent proportions. The histogram reveals a bimodal distribution, with two prominent peaks around 1 and 2. The density curve reinforces this pattern, dipping near the midpoint and rising toward both ends, which confirms that very few observations fall between the two categories as shown in Fig. 3c.
The graph titled “Distribution of Tumor Size” illustrates how tumor sizes are spread across the dataset using a density-scaled histogram (blue bars) and a smoothed density curve (red line). The x-axis represents tumor size, while the y-axis shows density, indicating the relative frequency of observations. Most tumors are concentrated at smaller sizes, with the highest density occurring roughly between 2 and 4 units, as evidenced by the tallest bars and the peak of the red curve in this region. As tumor size increases, the frequency steadily declines, producing a right-skewed (positively skewed) distribution with a long tail extending toward larger sizes (up to around 14). This tail suggests that large tumors are relatively rare but present in the data, possibly representing advanced or late-detected cases. Overall, the graph indicates that small to moderate tumor sizes are common, while very large tumors occur infrequently, resulting in a non-symmetric distribution dominated by lower values as shown in Fig. 3d.
The graph shows the distribution of the number of involved lymph nodes using a density-based histogram and a density curve. The x-axis represents the count of involved nodes, while the y-axis indicates the density. The distribution has very large concentration of observations at 0, indicating that most patients have no involved lymph nodes. A smaller but noticeable peak occurs around 1, showing that some patients have exactly one involved node. As the number of involved nodes increases beyond 1, the frequency drops, and values of 2 or 3 rarely appear. The graph suggests that lymph node involvement is uncommon in the dataset, with most cases showing none or minimal involvement as shown in Fig. 3e.
This graph shows a bimodal density distribution of metastasis variable. It shows two distinct peaks. One very peak at 0 and a density of approximately 12, indicating a large proportion of cases with no metastatic involvement. The other peak occurred at 1, with a density of approximately 6, showing another substantial group of cases with complete metastasis as shown in Fig. 3f.
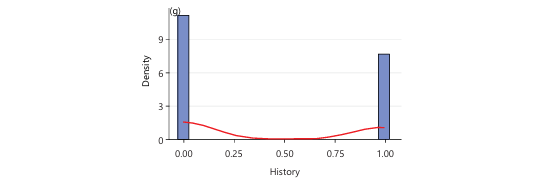
Histogram and density curve are the graphs used to show the distribution of patient personal or family history. There are two peaks which occur at 0 (no history) and 1 (positive history). A density of about 10, which depicts large cluster of cases with no history and a density of about 8 which shows a significant number of cases with positive history. The density curve forms a u-shaped bimodal pattern, indicating that the observations fall either under the category of “no history” or “positive history” as shown in Fig. 3g.
|
|
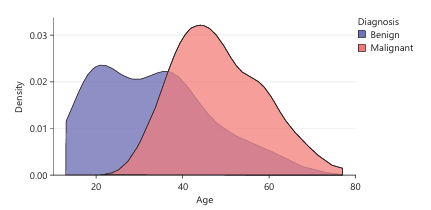
Figure 4 is a density plot that shows the distribution of ages among two groups of women based on their cancer diagnosis: Benign and Malignant. It allows us to compare how age is associated with the likelihood of having a benign or malignant diagnosis. Most benign cases occur in younger women, largely between 20 to 45 but very few benign cases occur after age 60. The benign cases peaks around early 30s to mid-30s. the red area extends further to the right, indicating more malignant cases in older women, especially between 45 to 70. It peaks around mid-40s to early 50s. There is some overlap between the groups around age 40, suggesting this is a transitional age where both benign and malignant diagnoses are common.
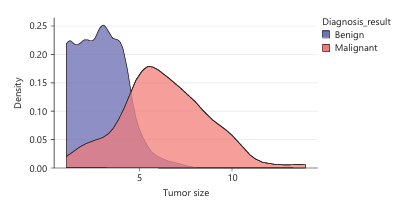
Figure 5 is a density plot comparing the tumor size distributions of women with benign and malignant diagnoses. It helps us understand how tumor size is related to the likelihood of having cancer. For benign tumor, peak density occurs at small tumor sizes, approximately between 1 and 3. The curve drops off significantly after 4-5, indicating that larger benign tumors are rare. Malignant tumors start to increase around 2-3, with a peak between 5 and 6. It tend to be larger, with a broader and flatter distribution extending beyond 10. This indicates a higher likelihood of malignancy as tumor size increases. There is a moderate overlap around tumor size 2 to 5, where both benign and malignant cases occur. Beyond size 5, the chances of a tumor being malignant increases sharply.
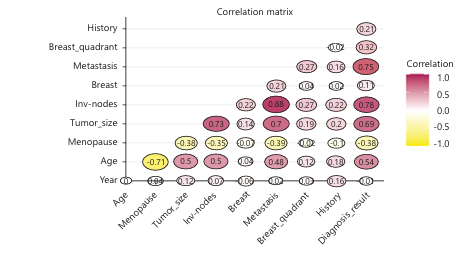
Figure 6 helps to identify how variables are linearly related to one another. Invasive nodes, metastasis and tumor size have a very strong influences on diagnosis result. They are medically significant because they relate to cancer progression. Meanwhile, age, year and breast quadrant have a minimal impact based on linear correlation alone.
|
|
|
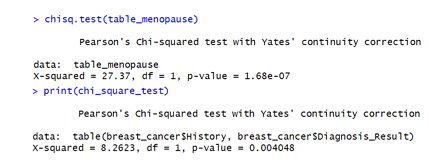
Figure 7 is a Chi-square analysis of history and diagnosis result using stats package in R software version 4.4.2. It shows that there is strong evidence to suggest that a patient’s family history of breast cancer is significantly associated with the diagnosis result (malignant or benign). Even though in the earlier correlation matrix we saw only a small correlation between History and Diagnosis_Result (0.32), this Chi-square test shows that the association is statistically significant, though not necessarily strong in effect size.
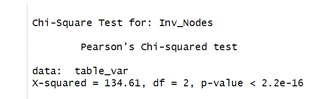
Figure 8 displays an extremely significant association between Invasive nodes and the variable it was tested against diagnosis result with the aid of R software version 4.4.2. This aligns well with the correlation matrix shared earlier, where Invasive nodes had very strong positive correlation with diagnosis result, tumor size and metastasis. Thus, lymph node involvement is a key factor in diagnosis and disease progression.
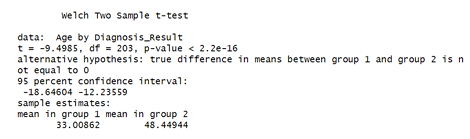
Figure 9 shows the result of a Welch Two-Sample t-test, which is used to compare the means of two independent groups when the variances of the two groups are not assumed to be equal. The test was conducted using stats package in R software version 4.4.2.
(Ho): There is no difference in mean age between women with benign and malignant tumors since p-value<0.05, we reject the null hypothesis. There is a statistically significant difference in the mean age between women diagnosed with benign and malignant breast cancer.
|
|
|
Age is a significant factor associated with the diagnosis outcome. This insight is valuable for risk stratification, early screening, and model development.
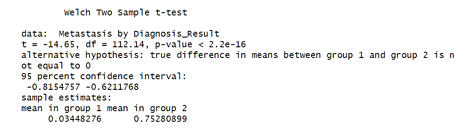
Figure 10 shows the result of a Welch Two-Sample t-test, use in testing whether there is a statistically significant difference in metastasis rates between women diagnosed with benign and malignant tumors. R software version 4.4.2 was used for this analysis.
(Ho): There is no difference in mean metastasis rate between benign and malignant diagnoses. Since the p-value is far below 0.05, we reject the null hypothesis. Implying that metastasis is strongly associated with malignancy in this dataset.
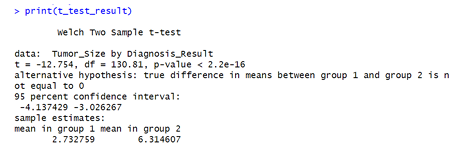
Figure 11 above is the test used to determine whether the average tumor size differs significantly between benign and malignant diagnoses. This analysis was conducted using stats package in R software version 4.4.2.
(Ho): Mean tumor sizes are equal in both groups (benign vs. malignant). Since the p-value is far below any conventional threshold 0.05, we reject the null hypothesis.
Tumor size is a highly significant predictor of whether a tumor is malignant or benign.
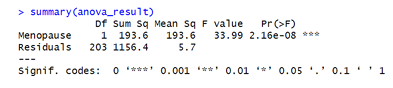
Similarly, Fig. 12 is the image showing the ANOVA (Analysis of Variance) summary table for the effect of Menopause on tumor size. The function lm on R software version 4.4.2 is used to perform this analysis. The F-value of 33.99 is very large, meaning the difference between menopausal groups is much bigger than random variations. A p-value less than 0.05 shows an extremely strong statistical significance. This suggests that menopause status is strongly associated with tumor size. Also, tumor growth patterns differ significantly based on whether a woman is pre- or post- menopausal.
|
|
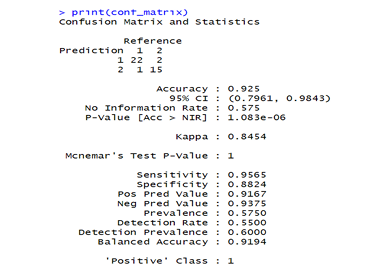
Figure 13 is a confusion matrix for the random forest model. The package “random forest” on R software version 4.4.2 was used to perform the analysis. The model performs exceptionally well with an accuracy greater than 90 percent and a kappa value of 84.54%. it detects positives and negatives reliably, without being heavily biased toward one class. Very low error rates and statistically highly significant results.
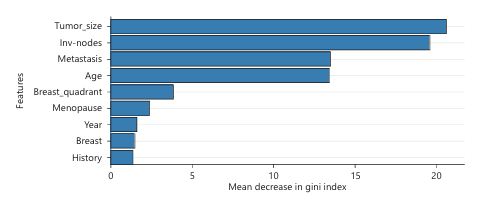
Figure 14 shows how important each feature is for making predictions in your Random Forest model. Tumor size is the most critical factor the random forest model relies on when predicting. Inv_nodes is nearly equally important, suggesting disease spread indicators are crucial. Metastasis and age are also very important features, but slightly less than tumor size and inv_nodes. Features like breast quadrant, menopause, year, breast side and history are less important but still contribute a little to the model.
DSCUSSION
The analysis began with preprocessing steps, including the removal of missing values across key variables such as year, tumor size, invasive lymph nodes, metastasis, and family history. Descriptive statistics revealed that the dataset consisted of more benign cases (117) than malignant ones (90). The distribution of patient age at diagnosis was unimodal and slightly right-skewed, with a peak between 45 and 55 years, indicating that most diagnoses occurred in middle-aged women. Tumor size and lymph node involvement also showed right-skewed distributions, with most tumors being small and minimal lymphatic spread in early-stage cases. However, malignant tumors tended to be larger and occurred more frequently among older women confirming the research and results5,12,16,17.
Density plots illustrated that benign cases peaked in women aged 30-35, whereas malignant cases were more prevalent between ages 45-70. This aligns with the assertion that the highest existing cases of malignant tumor exist among women12. Tumor size was notably larger in malignant cases, with a peak density between 5 and 6 units, in contrast to benign tumors, which clustered between 1 and 3 units. Inferential statistical tests confirmed these observations. Welch’s t-test results indicated significant differences in age, tumor size, and metastasis between the benign and malignant groups (p<0.05), rejecting the null hypothesis of equal means affirming that it is predominantly affecting older women thereby agreeing with5,12. A Chi-square test showed a statistically significant association between family history and diagnosis result, though the correlation strength was modest affirming the notion that risk factors like age, genetics, hormonal statuses, menopause transition and family history causes breast cancer cases3. Lymph node involvement (invasive nodes) showed a strong and statistically significant association with diagnosis outcome and other disease progression variables such as metastasis and tumor size which was postulated6 identifying casual diagnostic features and development of predictor models for decision making.
Furthermore, an ANOVA test revealed that menopause status significantly influenced tumor size (F = 33.99, p<0.05), with post-menopausal women tending to have larger tumors. This highlights the role of hormonal changes in tumor progression which confirms the findings15,16. To evaluate the predictive power of the variables, a Random Forest model was trained and validated as opined by Ching et al.6. The model performed with high accuracy (over 90%) and a kappa value of 84.54%, indicating strong agreement between predicted and actual outcomes. Feature importance analysis ranked tumor size as the most influential predictor, followed closely by invasive lymph nodes and metastasis. Age also contributed significantly, while menopause status, family history, and breast quadrant showed moderate to minimal influence on prediction validating the works of DeSaint et al.3. Overall, these findings underscore the clinical and statistical relevance of tumor size, lymph node involvement, metastasis, and age as primary determinants of breast cancer malignancy in the studied population which in turn possess a global health challenge8,17.
CONCLUSION
This study demonstrates that integrating classical statistical methods with machine learning can provide actionable insights for early breast cancer detection and risk stratification. Tumor size and lymph node status were reaffirmed as key clinical predictors. The analysis of the breast cancer dataset reveals that tumor size, lymph node involvement, metastasis, and patient age are the most influential factors associated with malignancy. Family history of breast disease and menopause status also contribute significantly to cancer risk and tumor characteristics. Statistical tests confirmed strong associations between these variables and diagnosis outcomes, supporting their clinical relevance. The Random Forest model achieved high predictive accuracy, emphasizing the potential of machine learning models in aiding diagnosis. While the findings provide critical insights, they should be interpreted with caution due to missing data and the limited scope of the sample, which is confined to a single hospital. The integration of machine learning with traditional statistics presents a promising approach to improving breast cancer screening and patient care. Limitations include missing values and data confined to a single institution. Future studies should use larger, multicenter datasets to enhance generalizability and refine predictive performance. Findings support the potential of data-driven models to assist in diagnostic decisions and personalized care pathways. Future research should incorporate larger, more diverse datasets to enhance the generalizability of these findings and refine predictive modeling efforts for breast cancer.
SIGNIFICANCE STATEMENT
This study discovered key clinical and machine learning–derived predictors of breast cancer malignancy, particularly tumor size, lymph node involvement, metastasis, and age, which can be beneficial for improving early diagnosis and risk stratification in resource-limited clinical settings. By integrating classical statistical analysis with Random Forest modeling, this study will help researchers to uncover critical areas of data-driven diagnostic support that many researchers were not able to explore. Thus, a new theory on hybrid statistical–machine learning–assisted clinical decision-making may be arrived at.
REFERENCES
- Sha, R., X.M. Kong, X.Y. Li and Y.B. Wang, 2024. Global burden of breast cancer and attributable risk factors in 204 countries and territories, from 1990 to 2021: Results from the Global Burden of Disease Study 2021. Biomarker Res., 12.
- Bray, F., J. Ferlay, I. Soerjomataram, R.L. Siegel, L.A. Torre and A. Jemal, 2018. Global cancer statistics 2018: GLOBOCAN estimates of incidence and mortality worldwide for 36 cancers in 185 countries. CA: Cancer J. Clin., 68: 394-424.
- DeSantis, C.E., J. Ma, M.M. Gaudet, L.A. Newman and K.D. Miller et al., 2019. Breast cancer statistics, 2019. CA: Cancer J. Clinicians, 69: 438-451.
- Edge, S.B. and C.C. Compton, 2010. The American Joint Committee on Cancer: The 7th edition of the AJCC Cancer Staging Manual and the future of TNM. Ann. Surg. Oncol., 17: 1471-1474.
- Rajpurkar, P., J. Irvin, K. Zhu, B. Yang and H. Mehta et al., 2017. CheXNet: Radiologist-level pneumonia detection on chest X-rays with deep learning. arXiv.
- Ching, T., D.S. Himmelstein, B.K. Beaulieu-Jones, A.A. Kalinin and B.T. Do et al., 2018. Opportunities and obstacles for deep learning in biology and medicine. J. R. Soc. Interface, 15.
- Breiman, L., 2001. Random forests. Mach. Learn., 45: 5-32.
- Giaquinto, A.N., H. Sung, K.D. Miller, J.L. Kramer and L.A. Newman et al., 2022. Breast cancer statistics, 2022. CA Cancer J. Clinicians, 72: 524-541.
- >Xiong, X., L.W. Zheng, Y. Ding, Y.F. Chen and Y.W. Cai et al., 2025. Breast cancer: Pathogenesis and treatments. Signal Transduction Targeted Ther., 10.
- Loibl, S., P. Poortmans, M. Morrow, C. Denkert and G. Curigliano, 2021. Breast cancer. Lancet, 397: 1750-1769.
- Siegel, R.L., A.N. Giaquinto and A. Jemal, 2024. Cancer statistics, 2024. CA: Cancer J. Clinicians, 74: 12-49.
- Nardin, S., E. Mora, F.M. Varughese, F. D'Avanzo and A.R. Vachanaram et al., 2020. Breast cancer survivorship, quality of life, and late toxicities. Front. Oncol., 16.
- Freihat, O., D. Sipos and A. Kovacs, 2025. Global burden and projections of breast cancer incidence and mortality to 2050: A comprehensive analysis of GLOBOCAN data. Front. Public Health, 13.
- Bellanger, M., N. Zeinomar, P. Tehranifar and M.B. Terry, 2018. Are global breast cancer incidence and mortality patterns related to country-specific economic development and prevention strategies? J. Global Oncol., 4.
- Torre, L.A., F. Islami, R.L. Siegel, E.M. Ward and A. Jemal, 2017. Global cancer in women: Burden and trends. Cancer Epidemiol. Biomarkers Prev., 26: 444-457.
- Ghoncheh, M., Z. Pournamdar and H. Salehiniya, 2016. Incidence and mortality and epidemiology of breast cancer in the world. Asian Pac. J. Cancer Prev., 17: 43-46.
- Bray, F., M. Laversanne, H. Sung, J. Ferlay, R.L. Siegel, I. Soerjomataram and A. Jemal, 2024. Global cancer statistics 2022: GLOBOCAN estimates of incidence and mortality worldwide for 36 cancers in 185 countries. CA: Cancer J. Clinicians, 74: 229-263.
How to Cite this paper?
APA-7 Style
Omini,
A.A., Concord,
D.l. (2026). Machine Learning‑Based Analysis of Breast Cancer Data from University of Calabar Teaching Hospital Patients. Trends in Biological Sciences, 2(1), 61-73. https://doi.org/10.21124/tbs.2026.61.73
ACS Style
Omini,
A.A.; Concord,
D.l. Machine Learning‑Based Analysis of Breast Cancer Data from University of Calabar Teaching Hospital Patients. Trends Biol. Sci 2026, 2, 61-73. https://doi.org/10.21124/tbs.2026.61.73
AMA Style
Omini
AA, Concord
Dl. Machine Learning‑Based Analysis of Breast Cancer Data from University of Calabar Teaching Hospital Patients. Trends in Biological Sciences. 2026; 2(1): 61-73. https://doi.org/10.21124/tbs.2026.61.73
Chicago/Turabian Style
Omini, Abam, Ayeni, and Diala leona Concord.
2026. "Machine Learning‑Based Analysis of Breast Cancer Data from University of Calabar Teaching Hospital Patients" Trends in Biological Sciences 2, no. 1: 61-73. https://doi.org/10.21124/tbs.2026.61.73

This work is licensed under a Creative Commons Attribution 4.0 International License.