Phenotypic Variability, Trait Association and Path Coefficient Analysis of Cherry Tomato (Solanum lycopersicum Var. Cerasiforme) Genotypes
-
Mohammad Zahir Ullah


Food Crops Section, Bangladesh Institute of Research and Training on Applied Nutrition, Head Office, Araihazar, Narayanganj, Bangladesh
| Received 23 Apr, 2025 |
Accepted 29 Jun, 2025 |
Published 30 Jun, 2025 |
Background and Objective: This study addresses the phenotypic variability, trait associations, and path coefficient analysis of cherry tomato (Solanum lycopersicum var. cerasiforme) genotypes to identify promising genotypes for cultivation and industrial use in Bangladesh. The main aim was to evaluate the genetic variation, heritability, trait correlations, and their effects on fruit yield, along with identifying suitable genotypes for fresh and industrial purposes. Materials and Methods: The experiment was conducted at the Regional Research Station, BIRTAN, Noakhali, during 2021-2022 using a Randomized Block Design (RBD) with 11 cherry tomato genotypes and three replicates. Phenotypic traits, including fruit weight, number of fruits per plant, and yield, were recorded. Statistical analyses included correlation and path coefficient analysis to identify key traits influencing yield. Results: Genotype CT 22 had the highest number of fruits per cluster (13.96), and CT 35 recorded the highest average fruit weight (44.00 g). The highest fruit yield per plant was observed in CT 23 (8.68 kg). Significant positive correlations were found between fruit yield and traits such as fruits per cluster, plant height, and the number of clusters per plant. Path coefficient analysis identified clusters per plant, fruits per cluster, and pericarp thickness as key contributors to yield. The CT 23 exhibited the highest fruit yield and can be recommended for cultivation under Bangladesh conditions. Genotypes with higher pericarp thickness, like CT 35, CT 23, and CT 24, are suitable for industrial use, while CT 18, CT 19, and CT 26, with more locules, are desirable for the fresh market. Conclusion: This study provides valuable insights into phenotypic traits influencing fruit yield in cherry tomato genotypes, offering guidance for selecting suitable varieties for different purposes. Further research could focus on improving other yield-related traits and extending findings to commercial cultivation practices.
| Copyright © 2025 Mohammad Zahir Ullah. This is an open-access article distributed under the Creative Commons Attribution License, which permits unrestricted use, distribution, and reproduction in any medium, provided the original work is properly cited. |
INTRODUCTION
Cherry tomato is called Solanum lycopersicum var. cerasiforme, having a chromosome number 2n = 24. Indeterminate-type fruits are consumed more as a fruit rather than as a vegetable. It is also consumed either fresh as a salad or after cooking as a snack, and is very popular among children, like grapes. It is thought to be the ancestor of all cultivated tomatoes and bearing capacity that is greater than heirloom tomatoes. Though cherry tomato has become popular as a cash crop in some Asian countries is still new in Bangladesh. It is widely cultivated in Central America and is distributed in Korea, Germany, and Mexico.
Cherry tomato is a small type of tomato with a range of 10-40 g in weight, with oblong, round, and flattened shapes as well as red and yellow in color. It is growing quickly, ripens early, and is good for homestead garden planting1. They are perfect for making processed products like sauce, soup, ketchup, puree, curries, paste, powder, and sandwiches. Unripe green fruit is used for the preparation of pickles and chutney.
Cherry tomato is a major source of vitamins like ascorbic acid, beta-carotene, vitamin E, and minerals like calcium and fiber, important for human nutrition and health2. It also contains other nutrients like flavonoids, phenolic acids, and carotenoids3. Lycopene is a carotenoid substance good for humans. Lycopene can save lives from colon cancer and has an antioxidant property4. Collections should provide plant breeders with genetic variants, genes, or genotypes, allowing them to tackle the new challenges posed by production systems. To do so, it is essential to know the traits of the conserved genotypes. Results of a study conducted by Thakur et al.5 indicate that cherry tomatoes are generally of determinate, semi-determinate, or indeterminate growth habit; present long racemes with many fruits of intense color and flavor, generally round and weighing between 10 and 30 g; are resistant to diseases and tolerant to high relative humidity (>80%); have a high nutritional value because of their high vitamin C content (>57 mg/100 gfw). Cherry tomato has lycopene content as amount of 10 mg/100 g fresh weight2, which is considered high. Solanum lycopersicum var. cerasiforme and S. pimpinellifolium may be used as a source of genes to increase the lycopene content of species with low content6. The variety is generally considered to be similar but not identical to the wild relatives of the domestic tomato. It has become more popular all over the world because of a good source of vitamins A and C, solid content, good taste, and fruit set even at high temperature7. It is, therefore, essential to assess the quantum of genetic variability and, nature of character association concerning different characters, which would help plant breeders in planning a successful breeding programme.
Genetic parameters like genotypic coefficient of variation (GCV), phenotypic coefficient of variation (PCV), heritability, and genetic advance are useful biometrical tools for the determination of genetic variability. The yield is a complex trait, quantitative in nature, and an integrated function of a number of component traits. Therefore, selection for yield per se may not be much rewarding unless other yield-attributing traits are taken into consideration. Correlation study provides a measure of association between traits and helps to identify important characteristics to be considered while making a selection. Knowledge of the correlation between yield and other traits helps select a suitable plant type. From Bangladesh’s agro-ecological perspective, information regarding variability in cherry tomatoes needs to be studied for a successful breeding programme to breed new varieties. Therefore, 11 cherry tomato inbred lines were developed by BIRTAN, Noakhali. These were evaluated for phenotypic variability, trait association, and path coefficient analysis of cherry tomato genotypes to breed new varieties in Bangladesh. So, for the identification of suitable cherry tomato genotypes, the present research project was implemented with the following objectives of characterization of cherry tomato genotypes for growth and yield attributes, and selection of cherry tomato as an advanced line.
MATERIALS AND METHODS
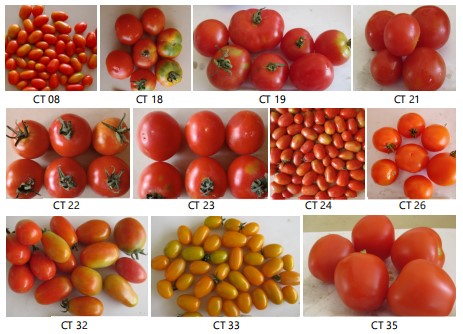
Study area: The experiment was conducted at the regional research station field, Bangladesh Institute of Research and Training on Applied Nutrition (BIRTAN), Noakhali, during the Rabi season of 2021-2022 with 11 cherry tomato inbred lines (Fig. 1).
|
Experiment design: The experiment was conducted in an RCB design with three replications. Cherry tomato seeds were sown on 15 October, 2021 in plastic trays. Regular irrigation and plant protection measures were taken to raise the good quality seedlings using growing media like a mixture of coco peat and farm yard manure in a 2:1 ratio. The 30 day old seedlings were transplanted in the field. The land was prepared properly and fertilized with cow dung, urea, TSP, and MP at the rate of 15 ton, 340, 430, and 250 kg/ha, respectively. The entire amount of cow dung, TSP, and MP was applied during land preparation, while urea was top-dressed twice at 30 and 45 days after transplanting. Unit plot size was 4.0×1.0 m with a space of 60×40 cm between row to rows and plants to plants, respectively. The experiment plots were kept free from weeds by hand weeding at frequent intervals. Other agronomic practices like Irrigation and intercultural operations were done as and when necessary. Ten plants were selected randomly from each plot for collecting data on growth and yield attributes for statistical analysis.
Data analysis: The ANOVA for the traits was performed using OPSTAT online software based on a Randomized Complete Block Design (RCBD), and the significance of differences among the genotypes was determined at a p≤0.05 level.
The genotypic and phenotypic coefficients of variation were calculated following Burton and DeVane8. The expected genetic advance for different characters was estimated as per Johson et al.9. Estimating genetic advance as a percentage of the mean was calculated10. The correlation coefficient was calculated following Panse and Sukhatme11.
RESULTS AND DISCUSSION
Varietal performance: Evaluation of 11 cherry tomato lines for growth and yield, and observed that all lines were found to differ significantly among themselves for all the traits (Table 1). A wide range of variation was observed concerning days to first flower. Genotype CT 32 required only 59.33 days to first flower, while the highest days were required for CT 08 (71.67). Some of the genotypes produced very tall plants. Among the genotypes, CT 23 was the tallest in height (212.67 cm), and it was statistically dissimilar and followed by CT 32 (175.67 cm) and CT 33 (149.67 cm). Genotype CT 23 had the highest number of clusters per plant (65.67) while CT 35 had the lowest number (12.00). The maximum number of fruits per cluster was recorded in CT 22 (13.96), and the minimum was recorded in CT 35 (5.74). A number of fruits per cluster might be due to the prevalence of microclimate, with better environmental conditions, with optimum temperature would help in the better pollination and ultimately lead to fruit set. Anwarzai et al.12 reported the number of fruits per cluster ranged from 4.30 to 8.70, with an overall mean of 5.90, and Mohanty13, Mehta and Asati14 reported similar results. Individual fruit weight ranged from 8.27 g (CT 24) to 44 g (CT 35). The variation of fruit weight might be due to the inverse relationship between fruit weight and fruits per cluster. This conforms with the findings of Renuka et al.15. The fruit weight directly contributes towards the fruit yield per plant. This was in agreement with the findings of Sharma and Thakur16 in tomato.
| Table 1: | Mean performance of 11 cherry tomato genotypes | |||
| Gen | Days to 1st flowering |
Days to 50% flowering |
Days to maturity |
Flowers per cluster |
Fruits per cluster |
Plant height (cm) |
Cluster per plant |
Fruits per plant |
Fruit weight (g) |
Fruit length (cm) |
Fruit dia (cm) |
Pericarp thickness (mm) |
Locule No. | Seeds per fruit |
Fruit yield per plant (kg) |
| CT08 | 71.67a | 76.67a | 115.33b | 12.78bc | 11.33b | 110.00e | 34.67cde | 392.89 | 11.62de | 3.17c | 2.07d | 2.70d | 2.00c | 32.33f | 4.61b |
| CT18 | 60.67c | 65.67cd | 119.33a | 10.00cd | 7.67cde | 125.67cde | 32.33de | 247.89 | 18.46cd | 2.67c | 3.47b | 3.93bcd | 4.00a | 127.33b | 4.54b |
| CT19 | 66.33b | 72.33b | 121.67a | 9.59de | 8.55c | 130.33cde | 29.67def | 253.75 | 18.00cd | 2.67c | 3.4b | 3.67bcd | 4.00a | 109.00c | 4.62b |
| CT21 | 60.33c | 65.33d | 121.33a | 8.74de | 6.36de | 144.00cd | 24.67ef | 156.8 | 24.53bc | 3.03c | 3.37b | 5.17b | 3.00b | 150.00a | 3.78bc |
| CT22 | 61.67c | 65.67cd | 108.33c | 18.22a | 13.96a | 137.33cd | 43.67bc | 609.73 | 8.33e | 2.73c | 2.03d | 3.33cd | 2.00c | 50.33e | 4.98b |
| CT23 | 60.33c | 65.67cd | 107.33c | 15.67ab | 11.37b | 212.67a | 65.67a | 746.41 | 11.61de | 2.67c | 2.00d | 5.00b | 2.00c | 110.67c | 8.68a |
| CT24 | 62.33c | 68.00c | 109.33c | 14.67b | 12.67ab | 122.67de | 38.33bcd | 485.56 | 8.27e | 3.73b | 2.63c | 5.03b | 2.00c | 33.00f | 3.92bc |
| CT26 | 71.00a | 76.00a | 121.33a | 10.44cd | 7.96cd | 149.00c | 20.00fg | 159.2 | 29.87b | 3.17c | 3.37b | 4.00bcd | 4.00a | 104.00c | 4.31b |
| CT32 | 59.33c | 64.67d | 110.00c | 9.56de | 8.62c | 175.67b | 38.67bcd | 333.44 | 24.33bc | 4.27a | 3.40b | 4.67bc | 2.00c | 72.67d | 8.20a |
| CT33 | 66.33b | 71.67b | 93.33d | 6.55e | 5.77e | 149.67c | 46.00b | 265.57 | 8.29e | 2.67c | 2.00d | 4.33bc | 2.00c | 35.33f | 2.21c |
| CT35 | 67.00b | 76.33a | 122.67a | 6.59e | 5.74e | 120.67de | 12.00g | 68.88 | 44.00a | 4.50a | 4.17a | 7.00a | 2.00c | 122.67b | 3.06bc |
| Min. | 59.33 | 64.67 | 93.33 | 6.55 | 5.74 | 110 | 12 | 68.88 | 8.27 | 2.67 | 2 | 2.7 | 2 | 32.33 | 2.21 |
| Max. | 71.67 | 76.67 | 122.67 | 18.22 | 13.96 | 212.67 | 65.67 | 746.41 | 44 | 4.5 | 4.17 | 7 | 4 | 150 | 8.68 |
| Mean | 64.27 | 69.82 | 113.64 | 11.16 | 9.09 | 143.42 | 35.06 | 338.19 | 18.85 | 3.21 | 2.9 | 4.44 | 2.64 | 86.12 | 4.81 |
| CV (%) | 2.62 | 2 | 2.05 | 14.91 | 12.02 | 9.07 | 17.06 | 20.34 | 23.15 | 9.54 | 8.92 | 18.01 | 0.01 | 7 | 20.76 |
| F-test | ** | ** | ** | ** | ** | ** | ** | ** | ** | ** | ** | ** | ** | ** | ** |
| CV (%): Coefficient of variation, **,*Level of significance at 1 and 5%, respectively and same letters differ insignificantly at the 5% level | |||||||||||||||
| Table 2: | Genetic parameters of 15 yield and yield-related traits of cherry tomato genotypes | |||
| Parameter | PCV | GCV | ECV | Heritability | Genetic advance (5%) | Genetic advance (Mean (%)) |
| DFF | 7.19 | 6.7 | 2.62 | 86.77 | 8.26 | 12.86 |
| D50F | 7.19 | 6.91 | 2 | 92.24 | 9.54 | 13.66 |
| DM | 8.1 | 7.84 | 2.05 | 93.58 | 17.75 | 15.62 |
| FC | 35.65 | 32.38 | 14.91 | 82.51 | 6.76 | 60.59 |
| FPC | 32.67 | 30.38 | 12.02 | 86.46 | 5.29 | 58.19 |
| PH | 21.63 | 19.63 | 9.07 | 82.4 | 52.66 | 36.71 |
| CPP | 43.22 | 39.71 | 17.06 | 84.42 | 26.35 | 75.16 |
| FPP | 63.27 | 59.51 | 21.46 | 88.49 | 390.26 | 115.32 |
| FW | 62.4 | 57.94 | 23.15 | 86.24 | 20.89 | 110.85 |
| FL | 22.3 | 20.16 | 9.54 | 81.69 | 1.2 | 37.53 |
| FD | 27.68 | 26.2 | 8.92 | 89.62 | 1.48 | 51.1 |
| PT | 29.69 | 23.6 | 18.01 | 63.2 | 1.72 | 38.65 |
| LN | 35.06 | 35.06 | 0 | 97.87 | 1.9 | 72.23 |
| SPF | 50.02 | 49.53 | 7 | 98.04 | 87.01 | 101.03 |
| FYP | 44.26 | 39.09 | 20.75 | 78.01 | 3.42 | 71.12 |
| DFF: Days to 1st flowering, D50F: Days to 50% flowering, DM: Days to maturity, FC: Flowers per cluster, FPC: Fruits per cluster, PH: Plant height (cm), CPP: Cluster per plant, FPP: Fruits per plant, FW: Fruit weight (g), FL: Fruit length (cm), FD: Fruit diameter (cm), PT: Pericarp thickness, LN: Locule number, SPF: Seeds per fruit and FYP: Fruit yield per plant (kg) | ||||||
The highest number of fruits per plant was recorded in CT 23 (746.41), and it was statistically similar to CT 22 (609.73). The lowest number of fruits per plant was recorded in CT 35 (68.88). Fruit size in respect of fruit length and fruit diameter, the genotype CT 35 had the biggest fruit (4.50×4.17 cm) while the genotype CT 33 had the smallest fruit (2.67×2.00 cm). Among all genotypes, pericarp thickness varied between 2.70 mm (CT 08) and 7.00 mm (CT 35). Pericarp thickness showed significant differences among the different cherry tomato genotypes. Similar results were reported by Najmul Hossain et al.17 in tomato. Higher pericarp thickness and firmness also improve the shelf life of fruit. Present findings are supported by the results obtained by Anwarzai et al.18 in tomato.
The maximum number of locules per fruit was observed in CT 18, CT 19, and CT 26 (4.00), which was followed by CT 21 (3.00). Tomato fruit with fewer locules is preferred for processing industries as it gives better firmness and indirectly better storability. The presence of a limited number of locules in cherry tomato (2-3) is preferred then fruit having more locules, as a cherry tomato is generally preferred as a table fruit vegetable. The data pertaining to the number of locules per fruit showed significant differences among the different cherry tomato genotypes. The minimum locules were observed in CT 08, CT 22, CT 23, CT 24, CT 32, and CT 33 (2.00). The highest yield per plant was observed in CT 23 (8.68 kg), and it was statistically similar to CT 32 (8.2 kg). The lowest yield per plant was recorded in genotype CT 33 (2.21 kg).
Genetic variability: The extent of variability to fifteen different traits among the genotypes measured in terms of genotypic coefficient of variation (GCV), phenotypic coefficient of variation (PCV), along with heritability, genetic advance, and genetic advance in percent of mean are presented in Table 2. In general, the phenotypic coefficient of variation (PCV) was higher than GCV in all the traits. GCV and PCV were high (>20%) for flower per cluster (35.65 and 32.38), fruits per cluster (32.67 and 30.38), cluster per plant (43.22 and 39.71), fruits per plant (63.27 and 59.51), fruit weight (62.40 and 57.94), fruit length (22.30 and 20.16), fruit diameter (27.68 and 26.20), pericarp thickness (29.69 and 23.60), locule number per fruit (35.06 and 35.06), seeds per fruit (50.02 and 49.53) and fruit yield per plant (44.26 and 39.09), respectively. The results for high estimates of phenotypic and genotypic coefficients variation for different characters are in agreement with the results reported by Anjum et al.19 in tomato and Najeema et al.2 in cherry tomato. Lower GCV and PCV were obtained for days to first flowering (7.19 and 6.70), days to 50% flowering (7.19 and 6.91), and days to maturity (8.10 and 7.84). All the traits were found to have high heritability (>60%). High heritability of traits indicates that these characteristics are less influenced by the environment. Genetic advance (GA) in per cent of mean was highest for fruits per plant (115.32) which was followed by fruit weight (110.85), seeds per fruit (101.03), cluster per plant (75.16), locule number per fruit (72.23), fruit yield per plant (71.12), flower per cluster (60.59), fruits per cluster (58.19), fruit diameter (51.10), pericarp thickness (38.65), fruit length (37.53) and plant height (36.71), whereas this estimate was the lowest for days to first flowering (12.86) followed by days to 50% flowering (13.66) and days to maturity (15.62).
Heritability and genetic advance: Heritability, genetic advance, and GCV together could provide the best image of the amount of advance to be expected from selection20. High values of GA, heritability, and GCV indicated that these characteristics were controlled by additive gene action, and the selection based on phenotype for these traits might be effective. However, high heritability but low GA and low GCV for days to first flowering, days to 50% flowering, and days to maturity showed the involvement of non-additive gene action, and the selection upon this character might not be promising. Characters with low heritability with low genetic advance can be improved through hybridization21.
Correlation study: Genotypic and phenotypic correlation coefficients for all pairs of fourteen traits are presented (Table 3). Days to first flowering was observed highly significant and positive correlation with days to 50% flowering in both phenotypic and genotypic level (rg = 0.973** and rp= 0.945**) and a significant negative correlation with plant height (rg = -0.479** and rp = -0.445**), cluster per plant (rg= -0.450** and rp = -0.395*) and fruit yield per plant (rg = -0.476** and rp = -0.471**). Significant negative correlation was found of days to 50% flowering with plant height (rg = -0.486** and rp = -0.470**), cluster per plant (rg = -0.544** and rp = -0.494**), fruits per plant (rg = -0.476** and rp = -0.431*), and fruit yield per plant (rg = -0.520** and rp = -0.468**). Days to maturity had positive significant correlation with fruit weight (rg = 0.698** and rp = 0.619**), fruit diameter (rg = 0.762** and rp = 0.727**) and seeds per fruit (rg = 0.693** and rp = 0.661**); and negative significant correlation with plant height (rg = -0.379* and rp = -0.363*), cluster per plant (rg = -0.762** and rp = -0.691**) and fruits per plant (rg = -0.529** and rp = -0.482**). Flower per cluster observed positive significant correlation with fruits per cluster (rg = 0.978** and rp = 0.939**), cluster per plant (rg = 0.606** and rp = 0.512**), fruits per plant (rg = 0.898** and rp = 0.827**), and fruit yield per plant (rg = 0.468** and rp = 0.426*) at both genotypic and phenotypic levels. It was found negatively correlation with (rg = -0.638** and rp = -0.531**) and fruit diameter (rg = -0.678** and rp = -0.507**). Fruits per cluster revealed a positive significant correlation with (rg = 0.563** and rp = 0.464**), fruits per plant (rg = 0.861** and rp = 0.812**) and fruit yield per plant (rg = 0.414* and rp=0.401*).
| Table 3: | Genotypic and phenotypic correlations between yield and yield-related traits of cherry tomato | |||
| DFF | D50F | DM | FC | FPC | PH | CPP | FPP | FW | FL | FD | PT | SPF | ||
| D50F | Rg | 0.973** | ||||||||||||
| Rp | 0.945** | |||||||||||||
| DM | Rg | 0.182NS | 0.256NS | |||||||||||
| Rp | 0.219NS | 0.285NS | ||||||||||||
| FC | Rg | -0.261NS | -0.393* | -0.206NS | ||||||||||
| Rp | -0.199NS | -0.306NS | -0.158NS | |||||||||||
| FPC | Rg | -0.154NS | -0.281NS | -0.228NS | 0.978** | |||||||||
| Rp | -0.137NS | -0.234NS | -0.194NS | 0.939** | ||||||||||
| PH | Rg | -0.479** | -0.486** | -0.379* | 0.222NS | 0.068NS | ||||||||
| Rp | -0.445** | -0.470** | -0.363* | 0.124NS | 0.028NS | |||||||||
| CPP | Rg | -0.450** | -0.544** | -0.762** | 0.606** | 0.563** | 0.667** | |||||||
| Rp | -0.395* | -0.494** | -0.691** | 0.512** | 0.464** | 0.643** | ||||||||
| FPP | Rg | -0.382* | -0.476** | -0.529** | 0.898** | 0.861** | 0.487** | 0.887** | ||||||
| Rp | -0.337NS | -0.431* | -0.482** | 0.827** | 0.812** | 0.465** | 0.874** | |||||||
| FW | Rg | 0.210NS | 0.386* | 0.698** | -0.638** | -0.675** | -0.102NS | -0.792** | -0.748** | |||||
| Rp | 0.157NS | 0.336NS | 0.619** | -0.531** | -0.557** | -0.120NS | -0.734** | -0.691** | ||||||
| FL | Rg | 0.048NS | 0.229NS | 0.247NS | -0.297NS | -0.178NS | -0.158NS | -0.481** | -0.335NS | 0.647** | ||||
| Rp | -0.040NS | 0.132NS | 0.177NS | -0.271NS | -0.155NS | -0.100NS | -0.419* | -0.309NS | 0.587** | |||||
| FD | Rg | -0.033NS | 0.146NS | 0.762** | -0.678** | -0.658** | -0.257NS | -0.848** | -0.819** | 0.908** | 0.565** | |||
| Rp | 0.024NS | 0.167NS | 0.727** | -0.507** | -0.535** | -0.229NS | -0.717** | -0.691** | 0.811** | 0.481** | ||||
| PT | Rg | -0.255NS | 0.021NS | 0.198NS | -0.447** | -0.507** | 0.170NS | -0.314NS | -0.341NS | 0.690** | 0.637** | 0.586** | ||
| Rp | -0.277NS | -0.087NS | 0.051NS | -0.340NS | -0.367* | 0.171NS | -0.210NS | -0.238NS | 0.544** | 0.610** | 0.439* | |||
| SPF | Rg | -0.255NS | -0.149NS | 0.693** | -0.385* | -0.549** | 0.195NS | -0.394* | -0.442* | 0.661** | -0.026NS | 0.695** | 0.471** | |
| Rp | -0.237NS | -0.134NS | 0.661** | -0.319NS | -0.497** | 0.175NS | -0.352* | -0.400* | 0.594** | -0.029NS | 0.659** | 0.374* | ||
| FYP | Rg | -0.476** | -0.520** | -0.061NS | 0.468** | 0.414* | 0.783** | 0.576** | 0.609** | -0.154NS | 0.040NS | -0.169NS | -0.111NS | 0.100NS |
| Rp | -0.471** | -0.468** | -0.080NS | 0.426* | 0.401* | 0.696** | 0.567** | 0.599** | -0.084NS | 0.043NS | -0.133NS | -0.045NS | 0.085NS | |
| *Significant at 5% probability level, **Significant at 1% probability level, DFF: Days to 1st flowering, D50F: Days to 50% flowering, DM: Days to maturity, FC: Flowers per cluster, FPC: Fruits per cluster, PH: Plant height (cm), CPP: Cluster per plant, FPP: Fruits per plant, FW: Fruit weight (g), FL: Fruit length (cm), FD: Fruit diameter (cm), PT: Pericarp thickness, LN: Locule number, SPF: Seeds per fruit, FYP: Fruit yield per plant (kg) and NS: Non significant | ||||||||||||||
| Table 4: | Genotypic path coefficient analysis for yield and its components in cherry tomato genotypes | |||
| Traits | DFF | D50F | DM | FC | FPC | PH | CPP | FPP | FW | FL | FD | PT | SPF | rG |
| DFF | 2.743 | -2.94 | 1.016 | -0.404 | -0.605 | -0.863 | -3.922 | 5.621 | -0.677 | 0.157 | 0.17 | -0.664 | -0.108 | -0.76** |
| D50F | 2.669 | -3.021 | 1.428 | -0.608 | -1.103 | -0.875 | -4.743 | 6.995 | -1.246 | 0.754 | -0.759 | 0.053 | -0.063 | -0.520** |
| DM | 0.5 | -0.774 | 5.569 | -0.318 | -0.897 | -0.684 | -6.648 | 7.775 | -2.253 | 0.813 | -3.955 | 0.517 | 0.293 | -0.061 |
| FC | -0.717 | 1.187 | -1.146 | 1.547 | 3.842 | 0.399 | 5.288 | -13.198 | 2.06 | -0.98 | 3.514 | -1.166 | -0.163 | 0.468** |
| FPC | -0.422 | 0.848 | -1.271 | 1.513 | 3.93 | 0.122 | 4.911 | -12.667 | 2.18 | -0.587 | 3.414 | -1.324 | -0.232 | 0.414* |
| PH | -1.313 | 1.467 | -2.113 | 0.343 | 0.265 | 1.803 | 5.817 | -7.157 | 0.329 | -0.52 | 1.334 | 0.444 | 0.082 | 0.783** |
| CPP | -1.234 | 1.643 | -4.245 | 0.938 | 2.213 | 1.202 | 8.721 | -13.047 | 2.558 | -1.588 | 4.4 | -0.818 | -0.166 | 0.576** |
| FPP | -1.048 | 1.437 | -2.944 | 1.389 | 3.385 | 0.877 | 7.738 | -14.705 | 2.416 | -1.107 | 4.248 | -0.89 | -0.187 | 0.609** |
| FW | 0.575 | -1.165 | 3.886 | -0.987 | -2.653 | -0.184 | -6.908 | 11.004 | -3.229 | 2.134 | -4.708 | 1.801 | 0.28 | -0.154 |
| FL | 0.131 | -0.69 | 1.372 | -0.459 | -0.698 | -0.284 | -4.196 | 4.932 | -2.088 | 3.301 | -2.931 | 1.662 | -0.011 | 0.04 |
| FD | -0.09 | -0.442 | 4.246 | -1.048 | -2.586 | -0.463 | -7.398 | 12.043 | -2.931 | 1.865 | -5.187 | 1.529 | 0.294 | -0.169 |
| PT | -0.698 | -0.062 | 1.104 | -0.691 | -1.993 | 0.307 | -2.736 | 5.017 | -2.229 | 2.103 | -3.041 | 2.609 | 0.199 | -0.111 |
| SPF | -0.699 | 0.449 | 3.861 | -0.595 | -2.156 | 0.351 | -3.434 | 6.494 | -2.134 | -0.086 | -3.605 | 1.23 | 0.423 | 0.1 |
| *Significant at 5% probability level, **Significant at 1% probability level, rG: Genotypic correlation with fruit yield per plant, Residual value-0.156, Bold, DFF: Days to 1st flowering, D50F: Days to 50% flowering, DM: Days to maturity, FC: Flowers per cluster, FPC: Fruits per cluster, PH: Plant height (cm), CPP: Cluster per plant, FPP: Fruits per plant, FW: Fruit weight (g), FL: Fruit length (cm), FD: Fruit diameter (cm), PT: Pericarp thickness, LN: Locule number, SPF: Seeds per fruit and FYP: Fruit yield per plant (kg) | ||||||||||||||
Negative significant correlation of fruit per cluster was observed with fruit weight (rg = -0.675** and rp = -0.557**), fruit diameter (rg = -0.658** and rp = -0.535**), pericarp thickness (rg = -0.507** and rp = -0.367*), and seeds per fruit (rg = -0.549** and rp = -0.497**). A positive significant correlation was observed of plant height with cluster per plant (rg = 0.667** and rp = 0.643**), fruits per plant (rg = 0.487** and rp = 0.465**), and fruit yield per plant (rg = 0.783** and rp = 0.696**). Fruits per plant was observed positive and significant correlation with (rg = 0.609** and rp = 0.599**). On the contrary, it was negatively correlated with fruit weight (rg = -0.748** and rp = -0.691**), fruit diameter (rg = -0.819** and rp = -0.691**) and seeds per fruit (rg = -0.442* and rp = -0.400*). The significant positive correlation was recorded for fruit weight with fruit length (rg = 0.647** and rp = 0.587**), fruit diameter (rg = 0.908** and rp = 0.811**), pericarp thickness (rg = 0.690** and rp = 0.544**) and seeds per fruit (rg = 0.661** and rp = 0.594**).
Positive significant correlation of fruit length was found with fruit diameter (rg = 0.565** and rp = 0.481**) and pericarp thickness (rg = 0.637** and rp = 0.610**). Fruit diameter was observed to be positively significant correlated with pericarp thickness (rg = 0.586** and rp = 0.439*) and seeds per fruit (rg = 0.695** and rp = 0.659**). Pericarp thickness was observed to be positively correlated with seeds per fruit (rg = 0.471** and rp = 0.374*). The present results show similarity with the results reported by Mehta and Asati14 in tomato.
Path coefficient analysis: Path coefficient analysis facilitates the partitioning of correlation coefficients into direct and indirect effects of various characters on yield and yield-attributing traits. Therefore, information on the cause and effect of various yield and yield attributes and the relative importance of their direct and indirect effects on yield in cherry tomato is essential in the crop improvement programme. Correlation studies in conjunction with path coefficient analysis revealed a better picture of the cause-and-effect relationship of different attributes. The data on path coefficient analysis at the genotypic level, showing direct and indirect effects of significant characters over fruit yield per plant, is tabulated in Table 4. The path coefficient analysis revealed that among these characters, cluster per plant (8.721) exhibited very high positive direct effect on fruit yield per plant, and it was supported by earlier findings of Alam et al.22. High positive direct effects on fruit yield per plant through days to maturity (5.569) and days to first flowering (2.743) was supported by earlier findings of Manna and Paul23. Fruit per cluster (3.930) and fruit length (3.301) had a positive direct effect on yield per plant.
Seeds per fruit had a positive direct effect on yield. Pericarp thickness (2.609) had a positive direct effect on yield, which was by Kumar et al.24. Days to 50% flowering (-3.021) had a negative direct effect on total yield. Equatorial diameter of the fruit (-5.187) had a negative direct effect on total yield. The present research findings indicate that direct selection of cluster per plant, days to maturity, fruits per cluster, fruit length, pericarp thickness, days to first flowering, flower per cluster, plant height and seeds fruit can be used as basis of selection for improvement in cherry tomato in respect of fruit yield per plant.
It can be concluded that cluster per plant, days to maturity, fruits per cluster, fruit length, pericarp thickness, days to first flowering, flower per cluster, plant height and seeds fruit can be put to direct selection pressure to increase yield of the cherry tomato because these characters exerted direct effect on yield.
CONCLUSION
The variability of the investigated morphological traits was determined for all genotypes included in the analysis. The highest variability was established in fruit weight (CV 23.15%), fruit yield per plant (CV 20.76%), and fruits per plant (CV 20.34%). Number of clusters per plant, fruits per cluster, fruits per plant, and plant height showed high heritability, greater genetic gain, and significant positive correlation with yield. Selection can therefore be based on these characters, and their phenotypic expression would be a good indicator of their genotypic potential. Path analysis revealed that clusters per plant, fruit per cluster, days to maturity, fruit length, and pericarp thickness exhibited a high positive direct effect on fruit yield per plant. So, it is concluded that these traits may be considered as the selection criteria for the improvement of cherry tomato fruit yield. Among the genotypes, CT 23 produced the highest number of fruits per plant (746.41) as well as the highest fruit yield (8.68 kg per plant) and can be selected for cultivation under Bangladesh conditions. Genotypes CT 35, CT 23, and CT 24 with high pericarp thickness and a lower number of locules are better for long shelf life and are intended for industrial purposes. Genotypes CT 18, CT 19, and CT 26 with higher locules are desirable for the creation of cultivars for fresh consumption.
SIGNIFICANCE STATEMENT
This study identified promising cherry tomato genotypes (CT 23, CT 35, CT 24, CT 18, CT 19, and CT 26) based on yield potential, pericarp thickness, and locule number, which could be beneficial for enhancing industrial processing and table consumption quality. This study will assist researchers in uncovering critical areas of genotype-based trait selection and nutritional improvement that have remained unexplored by many. Consequently, a new theory on genotype-specific utilization strategies in cherry tomato cultivation may be developed.
ACKNOWLEDGMENT
The authors are highly thankful to the Bangladesh Institute of Research and Training on Applied Nutrition (BIRTAN), Araihazar, Narayanganj, Bangladesh for providing technical and financial (12.09.0000.005.22-246) assistance during the research programed.
REFERENCES
- Zahir Ullah, M., M. Samsuzzaman, M.S. Alam, J.L. Barua and E. Parvin, 2022. Evaluation of cherry tomato (Solanum lycopersicum L. var. cerasiforme) genotypes for growth and yield attributes. Trop. Agrobiodiversity, 3: 40-46.
- Najeema, M.H., Revanappa, H.P. Hadimani and I.B. Biradar, 2018. Evaluation of cherry tomato (Solanum lycopersicum var. cerasiforme) genotypes for yield and quality traits. Int. J. Curr. Microbiol. Appl. Sci., 7: 2433-2439.
- Kuti, J.O. and H.B. Konuru, 2005. Effects of genotype and cultivation environment on lycopene content in red-ripe tomatoes. J. Sci. Food Agric., 85: 2021-2026.
- Imran, M., F. Ghorat, Iahtisham Ul-Haq, Habib Ur-Rehman and F. Aslam et al., 2020. Lycopene as a natural antioxidant used to prevent human health disorders. Antioxidants, 9.
- Thakur, N., B.S. Dogra, J. Kaur and B.M. Harish, 2025. Genetic diversity of morpho physiological traits in cherry tomato genotypes in North-Western Himalayas. Bangladesh J. Bot., 54: 105-111.
- Acharya, B., S. Hazra, S. Gorai, S. Bose and P. Hazra et al., 2025. Genetic control of fruit quality characters in the segregating generations of interspecific crosses and metabolic profiling of the fruits of promising segregants of tomato. S. Afr. J. Bot., 181: 1-13.
- Zhang, J., S. Liu, X. Zhu, Y. Chang and C. Wang et al., 2023. A comprehensive evaluation of tomato fruit quality and identification of volatile compounds. Plants, 12.
- Burton, G.W. and E.H. DeVane, 1953. Estimating heritability in tall fescue (Festuca arundinacea) from replicated clonal material. Agron. J., 45: 478-481.
- Johnson, H.W., H.F. Robinson and R.E. Comstock, 1955. Estimates of genetic and environmental variability in soybeans. Agron. J., 47: 314-318.
- Ali, A., M.J. Momand, M. Ali, Saeed Ur Rahman and S. Abbas, 2024. Estimation of phenotypic and genotypic correlation analysis in F3 populations of bread wheat genotypes. Turkish J. Agric. Food Sci. Tech., 12: 905-910.
- Panse, U.G. and P.V. Sukhatme, 1967. Statistical Method For Agricultural Workers. 2nd Edn., Indian Council of Agricultural Research, New Delhi, India, Pages: 381.
- Anwarzai, N., J. Kattegoudar, M. Anjanappa, M. Sood, B.A. Reddy and S.M. Kumar, 2020. Evaluation of cherry tomato (Solanum lycopersicum L. var. cerasiforme) genotypes for growth and yield parameters. Int. J. Curr. Microbiol. Appl. Sci., 9: 459-466.
- Mohanty, B.K., 2007. Genetic variability, correlation and path coefficient studies in tomato. Indian J. Agric. Res., 37: 68-71.
- Mehta, N. and B.S. Asati, 2008. Genetic divergence for fruit characters in tomato (Lycopersicon esculentum Miller). Agric. Sci. Dig., 28: 141-142.
- Renuka, D.M., A.T. Sadashiva and M. Jogi, 2017. Genetic variability studies in cherry tomato (Solanum lycopersicum L. var. cerasiforme Mill). Int. J. Curr. Microbiol. Appl. Sci., 6: 2085-2089.
- Sharma, D. and M.C. Thakur, 2008. Evaluation of diallel progenies for yield and its contributing traits in tomato under mid-hill conditions. Indian J. Hortic., 65: 297-301.
- Najmul Hossain, M.H. Rubel, M. Rafiqul Islam, P.K. Jhan and M.M. Kamal et al., 2025. Assessment of tomato genotypes using morpho-physical and biochemical traits in Southern Bangladesh. Res. Agric. Livest. Fish., 12: 105-119.
- Anwarzai, N., J. Kattegoudar, M. Anjanappa, M. Sood, A. Reddy and S.M. Kumar, 2020. Evaluation of cherry tomato (Solanum lycopersicum L. var. cerasiforme) genotypes for yield and quality parameters. Int. J. Curr. Microbiol. Appl. Sci., 9: 467-472.
- Anjum, A., N. Raj, A. Nazeer and S.H. Khan, 2009. Genetic variability and selection parameters for yield and quality attributes in tomato. Indian J. Hortic., 66: 73-78.
- Kotal, B.D., A. Das and B.K. Choudhury, 2010. Genetic variability and association of characters in wheat (Triticum aestivum L.). Asian J. Crop Sci., 2: 155-160.
- Liang, G.H.L. and T.L. Walter, 1968. Heritability estimates and gene effects for agronomic traits in grain sorghum, Sorghum vulgate Pers. Crop Sci., 8: 77-81.
- Alam, M.S., M.N. Huda, M.S. Rahman, A.K.M. Azad, M. Rahman and M.M. Molla, 2019. Character association and path analysis of tomato (Solanum lycopersicum L.). J. Biosci. Agric. Res., 22: 1815-1822.
- Manna, M. and A. Paul, 2012. Studies on genetic variability and characters association of fruit quality parameters in tomato. HortFlora Res. Spectr., 1: 110-116.
- Kumar, K., D. Sharma, J. Singh and P. Thakur, 2020. Correlation and path coefficient analysis in tomato (Solanum lycopersicum L.). Int. J. Curr. Microbiol. Appl. Sci., 9: 1944-1950.
How to Cite this paper?
APA-7 Style
Ullah,
M.Z. (2025). Phenotypic Variability, Trait Association and Path Coefficient Analysis of Cherry Tomato (Solanum lycopersicum Var. Cerasiforme) Genotypes. Trends in Biological Sciences, 1(1), 69-79. https://doi.org/10.21124/tbs.2025.69.79
ACS Style
Ullah,
M.Z. Phenotypic Variability, Trait Association and Path Coefficient Analysis of Cherry Tomato (Solanum lycopersicum Var. Cerasiforme) Genotypes. Trends Biol. Sci 2025, 1, 69-79. https://doi.org/10.21124/tbs.2025.69.79
AMA Style
Ullah
MZ. Phenotypic Variability, Trait Association and Path Coefficient Analysis of Cherry Tomato (Solanum lycopersicum Var. Cerasiforme) Genotypes. Trends in Biological Sciences. 2025; 1(1): 69-79. https://doi.org/10.21124/tbs.2025.69.79
Chicago/Turabian Style
Ullah, Mohammad, Zahir.
2025. "Phenotypic Variability, Trait Association and Path Coefficient Analysis of Cherry Tomato (Solanum lycopersicum Var. Cerasiforme) Genotypes" Trends in Biological Sciences 1, no. 1: 69-79. https://doi.org/10.21124/tbs.2025.69.79

This work is licensed under a Creative Commons Attribution 4.0 International License.