
Glycogen as a Proxy Marker for Non-Alcoholic Fatty Liver Disease: Histochemical and Spectroscopic Insights
-
Samuel Adeleke

Department of Medical Laboratory Science, Bowen University, Iwo, Osun, Nigeria
Oghenedoro AvbunufeDepartment of Medical Laboratory Science, Bowen University, Iwo, Osun, Nigeria
Erioluwa AdesopeDepartment of Medical Laboratory Science, Bowen University, Iwo, Osun, Nigeria
Christopher IgbeneghuDepartment of Medical Laboratory Science, Ladoke Akintola University of Technology, Ogbomoso, Oyo, Nigeria
| Received 08 Mar, 2026 |
Accepted 24 Jul, 2026 |
Published 31 Dec, 2026 |
Background and Objective: Glycogen storage in the liver is a natural physiological function; however, its accumulation may also signify pathological states, such as Non-Alcoholic Fatty Liver Disease (NAFLD). This circumstance underscores the importance of employing the Periodic acid-Schiff (PAS) staining technique for its visualization. The objective of this research is to utilize Fourier Transform Infrared (FTIR) spectroscopy in conjunction with PAS staining to provide an objective and diagnostic quantification of glycogen levels to discriminate between NAFLD and normal liver. Materials and Methods: A total of 20 archival human samples from fatty liver cases and 10 normal livers were retrieved and sectioned at 4μm. The resulting sections underwent staining with Hematoxylin and Eosin, as well as PAS, both with and without diastase pre-treatment. A FTIR spectra were recorded from the sections of liver, organized into diastase-treated and untreated categories. The spectral intensities corresponding to glycogen at 1030 cm-1 were statistically analyzed using t-tests, with a predefined significance threshold of p<0.05. The Receiver Operating Characteristic (ROC) Curve method was applied to assess the specificity and sensitivity of the FTIR techniques. Results: Notable distinctions in glycogen concentration were observed between digested and undigested normal liver sections (0.79±0.01 vs 1.15±0.03, p = 0.002) and between pre-digested and undigested NAFLD liver sections (0.55±0.02 vs 1.35±0.06, p = 0.003), and between normal liver and NAFLD sections (1.15±0.03 vs 1.35±0.06, p = 0.01) validated by PAS photomicrographs. A FTIR analysis revealed a sensitivity of 100% and a specificity less than 80% in differentiating between pre-digested and undigested normal and pathological liver sections. Conclusion: A FTIR spectroscopy holds promise for the standardization of glycogen detection methodologies, such as PAS, and as an adjunct technique to discriminating NAFLDs from normal liver by offering a more objective and reproducible approach to measurement.
| Copyright © 2026 Adeleke et al. This is an open-access article distributed under the Creative Commons Attribution License, which permits unrestricted use, distribution, and reproduction in any medium, provided the original work is properly cited. |
INTRODUCTION
Glycogen is a complex carbohydrate made primarily of glucose units, intricately linked with minor amounts of phosphate and glucosamine1. The linkage within its linear chains occurs through α-1,4-glycosidic bonds, while the branch points are established via α-1,6-glycosidic linkages2. This structured arrangement results in a spherical configuration due to the even distribution of branch points throughout typical glycogen1. Functionally, glycogen is analogous to starch in animals, acting as the primary energy reserve in humans2,3. Its predominant reservoirs are found in the liver, skeletal muscle, and cardiac muscle, playing a crucial role in maintaining glucose homeostasis in the organism2,4. Histochemical evaluation of glycogen is a prevalent methodology in human polysaccharide research3. Histochemical analysis of glycogen is particularly significant in diagnosing glycogen storage diseases (GSDs) and various cancers, including rhabdomyosarcoma and seminoma3. A GSDs are hereditary metabolic disorders caused by a deficiency in specific enzymes responsible for glycogen degradation, leading to abnormal glycogen accumulation in the liver or skeletal muscles5. Recent investigations indicate that more than half of individuals afflicted with Non-Alcoholic Fatty Liver Disease (NAFLD) exhibit excessive glycogen accumulation in liver hepatocytes6,7. This finding is at odds with conventional interpretations of NAFLD pathology, which is recognized as the most prevalent chronic liver disease globally, characterized by a diverse range of liver damage, from simple steatosis to steatohepatitis and advanced fibrosis, often reflecting features seen in alcohol-induced liver damage in non-consumers of alcohol8,9. Central to this metabolic disorder is insulin resistance, identified as the primary risk factor for the development and progression of NAFLD. This resistance manifests in two forms: Systemic and hepatic, both indicating a reduced responsiveness of tissues to insulin9. Systemic insulin resistance, stemming from impaired GLUT4 receptor translocation on muscle cell membranes, results in diminished insulin-stimulated glucose uptake and glycogen synthesis9,10. In the liver, such resistance lessens the capacity of insulin to inhibit gluconeogenesis and stimulate hepatic glycogen synthesis, impairing it via the misregulation of glucokinase movement from the nucleus to the cytoplasm7,10. Additionally, insulin resistance promotes de novo lipogenesis, leading to triglyceride accumulation within hepatocytes (hepatic steatosis)9.
A substantial prospective study by Allende et al.6 found that glycogenosis, indicative of excessive glycogen accumulation, is prevalent among both adult and pediatric cases of NAFLD and correlates with clinical signs of insulin resistance. This finding contradicts the conventional understanding of NAFLD’s pathogenesis. Among 2047 liver biopsies analyzed, 54% exhibited glycogenosis. In adults, glycogenosis correlated with older age, female gender, elevated blood glucose levels, insulin usage, lower steatosis scores, lower stages of fibrosis, and increased hepatocyte damage, such as ballooning. Conversely, in children, it was associated with Hispanic ethnicity, elevated triglycerides, higher fasting glucose, reduced steatosis, and lower body weight6. The precise mechanisms behind excessive glycogen accumulation in NAFLD remain inadequately defined. It is suggested that disruptions in the interrelated carbohydrate and lipid metabolic pathways in the liver may contribute to glycogenosis in an environment where insulin-related pathways are circumvented, causing a shift of substrates among metabolic pathways. This diversion of substrates from lipid storage to glycogen accumulation may explain the identified link between glycogenosis and lower steatosis and fibrosis levels in NAFLD6,7. Supporting this, research indicates that individuals carrying a genetic variant in PPP1R3B, a regulator of hepatic glycogen metabolism, exhibit reduced hepatic steatosis, likely due to enhanced glucose diversion towards glycogen synthesis and decreased de novo lipogenesis7. Analyzing glycogenosis in NAFLD histologically, routine Hematoxylin and Eosin (H&E) staining reveals glycogenated hepatocytes distributed focally, frequently in patchy formations at the centrilobular zone. Individually, glycogenated hepatocytes display cytoplasmic pallor and appear enlarged or swollen without displacing their nuclear positions or disturbing cell contours; however, large lipid droplets create empty rounded spaces, pushing the nuclei aside7.
Traditional NAFLD diagnosis involves methods like elastography, histochemistry for fibrosis and fat, and techniques like GC-MS, NMR, and FTIR spectroscopy for quantifying fat. While lipid accumulation, often highlighted with Oil Red O staining, is crucial for NAFLD identification, processing often removes most lipid species except neutral lipids11,12. This, combined with the labor-intensive nature of these methods, has spurred the development of real-time biochemical measurements. While spectroscopic studies have investigated in situ lipid quantification in liver samples, they often overlook the importance of glycogen as a related indicator. Given the well-established link between lipid metabolism and glycogen accumulation in the liver13, and the relative ease of demonstrating glycogen in formalin-fixed paraffin-embedded tissues compared to lipids, glycogen detection should be more thoroughly considered in spectroscopic NAFLD assessments.
The most commonly used histochemical method for assessing glycogen content in tissues is the Periodic Acid Schiff (PAS) staining technique, a widely recognized approach in histopathology for visualizing carbohydrates and carbohydrate-rich substances within tissues. This method enables the identification, detection, and localization of polysaccharides, mucin, glycogen, certain glycoproteins, glycolipids, and even certain fungi in situ, rendering it an essential staining tool in histopathology and diagnostic medicine14.
The PAS reaction’s fundamental mechanism involves periodic acid’s oxidative action on glycol linkages found in glycogen, disrupting the carbon-carbon bonds connecting hydroxyl groups. This produces aldehydes from these oxidized glycol functional groups15. The subsequent coupling of the Schiff reagent with the resulting aldehydes yields a magenta-colored complex4. Since its introduction by McManus and Hotchkiss in 1948, the PAS method has often relied on subjective interpretation by pathologists7,16-18. This reliance on subjective evaluation limits objectivity and quantitative analysis, consequently influencing the precision of PAS results, which depend on various factors, including the technician’s expertise, reagent quality, and oxidation conditions (e.g., duration, oxidation strength, and oxidizer concentration). A PAS staining also lacks specificity for glycogen, as it can non-specifically stain other carbohydrate-containing entities, including glycoproteins, glycolipids, and mucins19. This non-specificity may result in inaccuracies in the demonstration of glycosubstances within tissue samples.
Fourier Transform Infrared (FTIR) spectroscopy emerges as an advantageous method for exploring the biochemical properties of biological samples, encompassing proteins, cellular compositions, and tissues20. As a non-invasive, non-destructive, label-free, highly sensitive, and rapid vibrational spectroscopic technique, it allows for the detailed examination of molecular changes associated with diseased tissues. A FTIR is capable of providing both qualitative and quantitative data on biomolecules, including glycogen in relation to metabolic disorders and glycogen storage diseases21-23. This approach, which has been adapted for tumor tissues and cells to accurately identify functional groups, bond types, and molecular structures, represents an expanding area of research focused on its applicability in cytological and histological diagnostics through spectral imaging24,25.
This research examines the effectiveness of FTIR spectroscopy as an adjunct to the standard PAS technique to distinguish NAFLD sections and normal liver while also aiming to evaluate its diagnostic capabilities for identifying glycogen depletion and retention caused by diastase treatment in both normal liver and pathological human liver tissues. A control group for comparison is set up, contributing to the standardization and quality assurance of conventional histopathological diagnostic practices.
MATERIALS AND METHODS
Ethical approval: The research conducted between July and October 2024 was duly approved on August 6, 2024, with an approval number BUTH/REC-1195 by the Bowen University Teaching Hospital Research Ethics Committee (BUTHREC) situated in Ogbomoso, Oyo State, Nigeria. The handling of the tissues followed guidelines established by the National Institutes of Health (NIH, 1985). Specifically, ethical clearance was acquired for the procurement of tissue blocks pertaining to Non-Alcoholic Fatty Liver Diseases (NAFLDs) from the histopathology laboratory.
Study area and duration: The study was conducted at the Histopathology Laboratory of Bowen University Teaching Hospital, Ogbomoso, Oyo State, Nigeria, over a period of four months (July-October 2024).
Study design: The research is a case-controlled study with archived pathological specimens of fatty liver disease and normal liver. Twenty tissue blocks associated with Non-Alcoholic Fatty Liver Disease (NAFLD) and ten normal livers were retrospectively retrieved from the archives. These samples were subsequently sectioned, stained for histological, histochemical, and spectroscopic analysis according to the STARD protocol.
Laboratory procedures
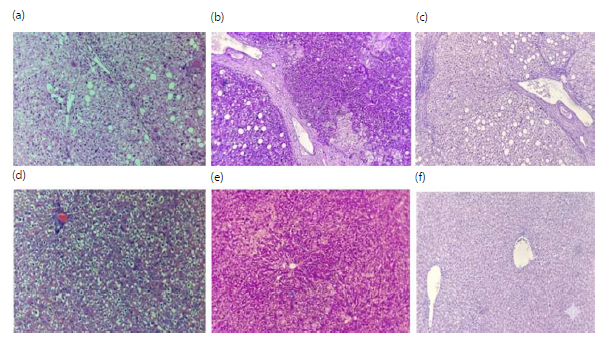
Tissue preparation for histological and FTIR analysis: The thirty paraffin blocks were sectioned into 4 μm thick slices for histopathological examination and 20 μm for FTIR analysis. In total, 30 paraffin-embedded liver sections were prepared, comprising normal liver tissues (10 sections) and pathological liver samples (20 sections). The histological sections were affixed to frosted glass slides and stained using Hematoxylin and Eosin to illustrate general tissue morphology, alongside special staining protocols employing Periodic Acid-Schiff (PAS) to highlight glycogen detection through magenta coloration, and PAS-Diastase (PAS-D) served as negative control sections (Table 1). Stained sections were examined under an Olympus binocular light research microscope independently by two pathologists, and photomicrographs were captured (Fig. 1). Following this, FTIR analyses were done using an Agilent Cary 630 Attenuated Total Reflectance-Fourier Transform Infrared (ATR-FTIR) Spectrometer on adjacent unstained normal and pathological sections pre-digested with diastase procured from Sigma, and those undigested before periodic acid oxidation per PAS protocols4.
Attenuated Total Reflectance-Fourier Transform Infrared (ATR-FTIR) spectroscopy: The Agilent Cary 630 spectrometer developed by Agilent Technologies was utilized to acquire FTIR spectra for all analyzed tissue sections4. The ATR technique employing a diamond crystal was utilized for measurements conducted within the infrared range of 4000 to 600 cm−1, with each sample undergoing 32 scans at a resolution of 16 cm−1. All measurements were repeated five times, point mapping different areas sequentially, to ensure adequacy and precision of measurement. The resultant spectra were normalized, smoothed, and subjected to baseline correction via Spectrograph software25. The spectra peaks assigned to glycogen bands, 1030 cm-1, for both test and control groups were extracted from the plot.
Statistical analysis: The FTIR peak intensity values corresponding to glycogen on predigested and undigested sections were extracted from the spectral graphs, and analysis was performed utilizing IBM SPSS Statistics 25 software, presenting the data in tabular format as mean±standard deviation. A comparative analysis was established between the undigested-oxidized and digested-oxidized sections from both normal and pathological samples employing a normality test to determine numerical data distribution and rule out outliers. A t-test was done, alongside assessing diagnostic model performance via receiver operating characteristic (ROC) curve to ascertain the sensitivity and specificity of FTIR in relation to the traditional PAS methodology. A significance threshold of p<0.05 and 95% confidence interval were maintained for this statistical evaluation, with results conveyed in tabular format.
RESULTS
Figure 1(a-f) presents representative photomicrographs comparing liver histomorphology, PAS reactivity, and PAS-D (diastase-digested) staining between NAFLD and normal liver tissues. In NAFLD samples (A-C), (a) H&E staining shows pronounced hepatocellular steatosis characterized by numerous large lipid vacuoles, ballooning degeneration, and fibrous septa disrupting the hepatic architecture, (b) PAS staining
|
|
|
| Table 1: | Proportion of PAS-positive and PAS-negative sections on normal liver and NAFLD | |||
| Oxidation status | Normal liver n = 10 | NAFLD n = 20 | |
| PAS staining status | PAS (+) Undigested sections | 10 | 20 |
| PAS-D (-) Predigested sections | 10 | 20 | |
| NAFLD: Non-alcoholic fatty liver disease, PAS: Periodic acid Schiff, D: Diastase, - : Negative staining status and +: Positive staining status | |||
demonstrates strong magenta positivity indicating marked glycogen accumulation within hepatocytes, whereas (c) PAS-D staining shows loss of PAS reactivity (blue/negative), confirming enzymatic digestion of glycogen. In contrast, (d-f) Normal liver tissues exhibit preserved hepatic architecture with radiating hepatic cords and intact sinusoidal spaces on H&E staining (d). (e) PAS staining reveals moderate glycogen distribution within hepatocytes and while (f) PAS-D staining shows negative/blue coloration following diastase treatment, confirming glycogen specificity. All images were captured at x400 magnification with a scale bar of 100 μm.
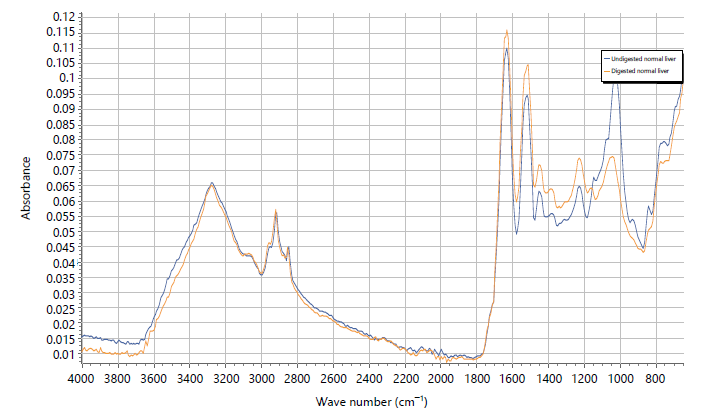
Figure 2 shows a comparison of average spectral data, highlighting the differences in glycogen levels in normal liver sections exposed to oxidation with periodic acid versus those pre-digested with diastase before oxidation. The glycogen peaks specifically at 1045 cm-1 was more intense on the undigested normal liver group (blue colour) compared with the predigested normal liver group (yellow colour).
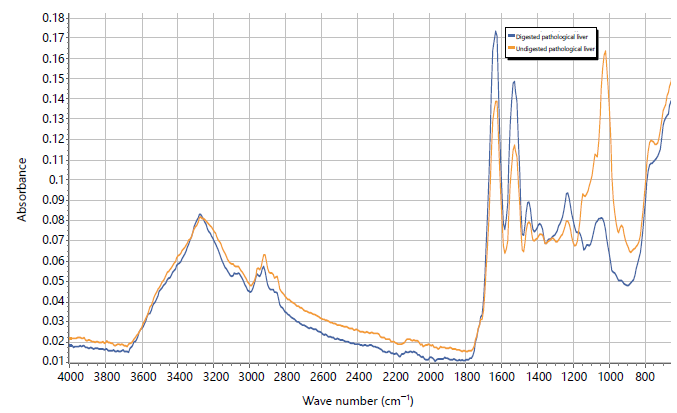
Figure 3 presents a comparative analysis of the mean spectral data related to glycogen content within the pathological liver sections. This comparison is between sections oxidized with periodic acid and those predigested with diastase before the oxidation process. The glycogen peaks specifically at 1045 cm-1 was more intense on the undigested non-alcoholic fatty liver disease group (yellow colour) compared with predigested non-alcoholic fatty liver disease liver group (blue colour annotation).
Table 1 shows the proportion of glycogen positive and negative resulting from both normal liver sections and NAFLDs when they are digested and undigested by diastase according to standard periodic acid Schiff staining protocols as reported by two independent observers.
| Table 2: | Comparison of the Mean±SD values of glycogen content between the undigested and predigested sections of both normal and pathological human liver samples | |||
| Liver sections | Digestion status before oxidation | Mean±SD | t-test | p-value |
| Glycogen | ||||
| Normal | Undigested | 1.15±0.03 | 20.72 | 0.002* |
| Predigested | 0.79±0.01 | |||
| Pathological (NAFLD) | Undigested | 1.35±0.06 | 18.02 | 0.003* |
| Predigested | 0.55±0.02 | |||
| SD: Standard deviation, *: Statistical significance and NAFLD: Non-alcoholic fatty liver disease | ||||
| Table 3: | Comparison between normal and pathological livers | |||
| Liver sections | Mean±SD | t-test | p-value |
| Glycogen | |||
| Normal | 1.15±0.03 | 5.52 | 0.01* |
| Pathological (NAFLD) | 1.35±0.06 | ||
| Table 4: | Sensitivity and specificity of FTIR to distinguish pre-digested and undigested glycogen in normal and NAFLD liver sections | |||
| 95% CI | ||||||||
| Tissues | AUC | SE | Lower bound | Upper bound (%) | Sensitivity (%) | Specificity | Cut-off | p-value |
| Glycogen ftir peaks | ||||||||
| Normal liver | 1 | 0.01 | 1 | 1 | 100 | 70 | 1 | 0.02 |
| NAFLD | 1 | 0.001 | 1 | 1 | 100 | 74 | 1 | 0.01 |
| Glycogen staining status | ||||||||
| Normal liver | 0.93 | 0.01 | 1 | 1 | 92 | 77 | 0.91 | 0.01 |
| NAFLD | 0.91 | 0 | 1 | 1 | 94 | 80 | 0.92 | 0.04 |
| AUC: Area under the curve, CI: Confidence interval, Temp: Temperature, SE: Standard error and NAFLD: Non-alcoholic fatty liver disease | ||||||||
| Table 5: | Correlation of normal liver and human fatty liver with spectral glycogen values and PAS staining status | |||
| Organ | Correlation | p-value |
| Normal Liver | ||
| Glycogen values | 0.822# | 0.007* |
| PAS staining status | 1.00# | 0.001* |
| NAFLD | ||
| Glycogen values | 0.931# | 0.01* |
| PAS Staining status | 1.00# | 0.000* |
| NAFLD: Non-alcoholic fatty liver disease, #: Strong correlation and *: Statistical significance | ||
Table 2 illustrates the comparative analysis of glycogen levels between undigested and predigested segments of both healthy and diseased liver tissues before undergoing periodic acid oxidation. The mean glycogen concentration in the undigested segment of normal liver is 1.15, which surpasses that found in the predigested normal liver segment (0.79). This disparity is statistically significant, with a t-value of 20.72 and a p-value of 0.002. Similarly, the mean glycogen content of the pathological undigested liver segment (1.35) exceeds that of the predigested counterpart (0.55), and this difference is also statistically significant (t = 18.02, p = 0.003).
Table 3 revealed glycogen levels between diastase untreated normal liver sections (1.15) and diastase untreated NAFLDs sections (1.35) with a significant difference (t = 5.52, p = 0.01).
Table 4 revealed that the performance test using the ROC curve showed that FTIR peaks for glycogen wane on diastase-predigested sections compared with the non-digested sections of both normal liver and pathological human liver conditions (NAFLD), with 100% sensitivity, 70-75% specificity, and ~ 1.0 model accuracy.
Table 5 revealed that there were strong correlations between conventional PAS staining positive and negative scorings and estimated glycogen values from spectral analysis on both normal (0.8-1.0) and pathological livers (0.93-1.0) sections treated and untreated with diastase.
DISCUSSION
The present investigation delved into the relevance and correlation of glycogen quantification utilizing the standard histochemical method of Periodic Acid Schiff (PAS) staining, aimed at identifying carbohydrate moieties in both liver sections and human liver sections affected by Non-Alcoholic Fatty Liver Disease (NAFLD) with FTIR spectroscopy. Existing studies have largely investigated the quantification of lipid accumulations during NAFLD development, especially in animal and cell models26-28. While it is true that glycogen is primarily stored in hepatocytes and epithelial cells of the liver, excessive lipid and glycogen accumulation may serve as an indicator of pathological adaptations. This alteration is prominently observed in cirrhotic tissues, NAFLD, malignancies, and glycogen storage disorders, thereby necessitating glycogen visualization3,5,29-34. While the PAS staining technique is commonly employed to evaluate glycogen content in liver tissues with appreciable sensitivity, it is limited in other tissues with relatively lower glycogen content, where it can only demonstrate spatial distributions of glycogen, rendering it largely subjective and predominantly qualitative. Given that glycogen storage and its structural organization can significantly fluctuate in response to various stimuli or environmental changes during exercise and illness18, PAS is characterized by its low specificity and sensitivity, as it also stains other polysaccharides like mucins and glycoproteins19,22. The impact of diastase digestion on the liver sections so treated was appreciated at the microscopic level compared with control sections with no such treatment (Fig. 1).
In this study, FTIR quantitatively characterized glycogen levels in both healthy liver and pathological paraffin-embedded human liver samples through the identification of relevant functional groups, bond types, and molecular conformations (Fig. 2 and 3)21. The FTIR spectra indicated glycogen-specific peaks at a wavenumber of 1045 cm-1, indicative of C-C or C-O stretching and C-OH stretching vibrations characteristic of carbohydrates21,32. Notably, the results from undigested sections of both normal and pathological liver samples demonstrated consistent spectral peaks, with varying intensities compared to their digested counterparts. The observation that magenta coloration appeared in all sections treated without diastase (from both normal and pathological) indicates the actual presence of glycogen in the tissues, signifying a positive result. Conversely, the lack of magenta at the microscopic level following diastase digestion suggests a reduced presence of glycogen rather than its total absence when quantitatively analyzed (Table 2). Statistical analyses revealed significant differences between the FTIR results of undigested and pre-digested liver sections in both pathological and normal liver samples, affirming that FTIR represents a methodological advancement that enhances precision and accuracy in glycogen quantification within paraffin-embedded tissues, thus addressing limitations inherent to traditional PAS staining techniques (Table 2-5)22,29. This suggests that FTIR is not only proficient in assessing glycogen levels in normal liver but also serves as an effective analytical approach for quantifying glycogen in human pathological liver samples, potentially aiding in the investigation and diagnosis of glycogen storage-related conditions.
Meanwhile, other methods for estimating glycogen levels have been explored through various analytical techniques35-40. However, each of these methods presents its unique set of limitations, and none have specifically tackled this issue in the context of fatty liver diseases. Consequently, the emergence of spectroscopic methods has refined the qualitative spatial analysis of glycogen in tissues by enabling precise quantification22,31,32.
The utility of FTIR spectroscopy to give a more precise estimate of glycogen at any reaction phase of PAS techniques in carbohydrate-related diseases/disorders aligns with prior studies that quantified and compared relative glycogen concentrations in different morphological states of Candida albicans during morphogenesis38. Moreover, the detection of glycogen in pathological human liver sections, as indicated by both PAS and PAS-D staining methods, alongside quantitative characterization through FTIR spectroscopy, has been corroborated in multiple studies22,29. The established connection between fatty liver diseases and carbohydrate metabolism is well documented34. Consequently, the human liver tissues diagnosed with Non-alcoholic Fatty Liver Disease (NAFLD) displayed characteristic lipid accumulation, as revealed by the microscopic examination using the Haematoxylin and Eosin staining method (Fig. 1a), highlighting vacuole-like spaces within hepatocytes (known as hepatic steatosis), macrovesicular ballooning, and fibrotic changes leading to a nodular arrangement with sparse neutrophilic infiltration. This finding appears paradoxical, considering that insulin resistance-a defining feature of NAFLD-typically results in reduced glycogen synthesis while promoting elevated glucose production in the liver9. Thus, it is plausible that the observed elevated glycogen levels in NAFLD patients reflect a dysfunctional interaction between carbohydrate and lipid metabolic pathways, culminating in glycogenosis7,34. Compelling evidence from a comprehensive study by Allende et al.6 supports this hypothesis, revealing that glycogenosis was present in over 50% of the 2,047 liver biopsies examined across both adult and pediatric populations, as indicated by visible glycogen accumulation under standard microscopy. This observation not only underscores a noteworthy anomaly but also suggests that abnormal glycogen storage may constitute a significant yet often overlooked aspect of NAFLD, functioning in tandem with the more widely acknowledged phenomenon of fat accumulation, a notion further corroborated by a similar study by Soon and Torbenson7.
Specifically, Fourier Transform Infrared Spectroscopy (FTIR) has been identified as a valuable complement to the PAS reaction, enhancing sensitivity and accuracy in the glycogen assessment within tissues, as shown in Table 3. In addition, FTIR results have shown consistency with other investigative techniques, including immunohistochemistry, real-time polymerase chain reaction, and lipidomics22,33-36, across both physiological and pathological conditions25.
Typically, considering the limited specificity frequently associated with Periodic Acid-Schiff (PAS) staining for the detection of glycogen19,37,38, the sensitivity and specificity results from the FTIR spectroscopy utilized in this study align with the outcomes of other research that utilized Matrix-Assisted Laser Desorption/Ionization Mass Spectrometry (MALDI-MS), Liquid Chromatography-Mass Spectrometry (LC-MS), and Nuclear Magnetic Resonance Spectroscopy (NMRS) for in situ imaging and quantification of glycogen39-42.
This experimental study, a test of the efficacy of ATR-FTIR spectroscopy in detecting glycogen changes upon diastase digestion, which is an important step in ruling out or establishing glycogen-related disorders, was promising. However, it is not without some shortcomings, such as non-differential scoring of PAS positivity, and restriction to a relatively small sample size used for both normal and abnormal human liver samples. In addition, this study did not investigate a wide range of glycogen-bearing tissue types, such as cardiac muscle, to broaden the application of these new methods. This study would have also benefited from imaging as a complementary method to track the glycogen retention and breakdown in real-time, which future work should consider.
CONCLUSION
In summary, the investigation into the clinical relevance of glycogen, alongside the shortcomings of conventional PAS staining methods, highlights the necessity for enhanced assessment approaches. This study identifies FTIR spectroscopy as a cost-effective, robust alternative that not only allows for precise quantification of glycogen in relation to NAFLD. By incorporating these sophisticated techniques into a clinical context, we can enhance our diagnostic proficiency, ultimately fostering improved management of glycogen storage disorders and associated conditions with greater objectivity, precision, and accuracy. This investigation should therefore conduct additional research examining the application of FTIR spectroscopy for glycogen assessment across diverse tissues and organs. Such investigations have the potential to enhance the diagnosis and treatment of a broader range of metabolic disorders. Furthermore, it is crucial to develop standardized methodologies for glycogen quantification in tissue samples using FTIR spectroscopy, which will enhance the consistency and reliability of results across various research facilities. Future research should also seek to incorporate artificial intelligence algorithms into the diagnostic pipeline for effectiveness and speed in identifying these metabolic patterns.
SIGNIFICANCE STATEMENT
Glycogen as a Proxy Marker for Non-alcoholic Fatty Liver: Histochemical and Spectroscopic Investigations looks at how glycogen buildup might help us diagnose Non-Alcoholic Fatty Liver Disease (NAFLD). This disease is responsible for much liver damage and related deaths. The researchers attempted to get better at spotting the disease using two main methods: a special dye called Periodic Acid-Schiff (PAS) staining and a method called Fourier Transform Infrared (FTIR) spectroscopy. The glycogen levels in liver samples from people with NAFLD were compared with those of normal livers. The goal is to see if glycogen could be a good, reliable sign of NAFLD. It was concluded that FTIR spectroscopy gives more exact data than the usual staining methods.
REFERENCES
- Adeva-Andany, M.M., M. González-Lucán, C. Donapetry-García, C. Fernández-Fernández and E. Ameneiros-Rodríguez, 2016. Glycogen metabolism in humans. BBA Clin., 5: 85-100.
- Daghlas, S.A. and N. Rahimi, 2026. Biochemistry, Glycogen. StatPearls Publishing, Treasure Island, Florida.
- Layton, C. and J.D. Bancroft, 2019. Carbohydrates. In: Bancroft's Theory and Practice of Histological Techniques, Suvarna, S.K., C. Layton and J.D. Bancroft (Eds.), Elsevier, Amsterdam, Netherlands, ISBN: 978-0-7020-6887-4, pp: 176-197.
- Titford, M., 2009. Progress in the development of microscopical techniques for diagnostic pathology. J. Histotechnol., 32: 9-19.
- Mott, J. and J.A. Morrison, 2019. Glycogen Storage Disease. In: Blackwell's Five-Minute Veterinary Consult Clinical Companion: Small Animal Gastrointestinal Diseases, Mott, J. and J.A. Morrison (Eds.), Wiley, New Jersey, ISBN: 9781119376293, pp: 729-733.
- Allende, D.S., S. Gawrieh, O.W. Cummings, P. Belt and L. Wilson et al., 2021. Glycogenosis is common in nonalcoholic fatty liver disease and is independently associated with ballooning, but lower steatosis and lower fibrosis. Liver Int., 41: 996-1011.
- Soon, G.S.T. and M. Torbenson, 2023. The liver and glycogen: In sickness and in health. Int. J. Mol. Sci., 24.
- Bugianesi, E., A. Gastaldelli, E. Vanni, R. Gambino and M. Cassader et al., 2005. Insulin resistance in non-diabetic patients with non-alcoholic fatty liver disease: Sites and mechanisms. Diabetologia, 48: 634-643.
- Chao, H.W., S.W. Chao, H. Lin, H.C. Ku and C.F. Cheng, 2019. Homeostasis of glucose and lipid in non-alcoholic fatty liver disease. Int. J. Mol. Sci., 20.
- Petersen, M.C., V.T. Samuel, K.F. Petersen and G.I. Shulman, 2020. Non-alcoholic Fatty Liver Disease and Insulin Resistance. In: The Liver: Biology and Pathobiology, Arias, I.M., H.J. Alter, J.L. Boyer, D.E. Cohen, D.A. Shafritz, S.S. Thorgeirsson and A.W. Wolkoff (Eds.), Wiley, New Jersey, ISBN: 9781119436812, pp: 455-471.
- Neuman, M.G., L.B. Cohen and R.M. Nanau, 2014. Biomarkers in nonalcoholic fatty liver disease. Can. J. Gastroenterol. Hepatol., 28: 607-618.
- Sreedhar, H., V.K. Varma, F.V. Gambacorta, G. Guzman and M.J. Walsh, 2016. Infrared spectroscopic imaging detects chemical modifications in liver fibrosis due to diabetes and disease. Biomed. Opt. Express, 7: 2419-2424.
- Szafraniec, E., S. Tott, E. Kus, D. Augustynska and A. Jasztal et al., 2019. Vibrational spectroscopy-based quantification of liver steatosis. Biochim. Biophys. Acta Mol. Basis Dis., 1865.
- Sridharan, G. and A.A. Shankar, 2012. Toluidine blue: A review of its chemistry and clinical utility. J. Oral Maxillofacial Pathol., 16: 251-255.
- Kiernan, J.A., 2015. Histological and Histochemical Methods: Theory and Practice. 5th Edn., Scion Publishing, Banbury, UK, ISBN: 9781907904325, Pages: 571.
- Ramos-Vara, J.A. and M.A. Miller, 2014. When tissue antigens and antibodies get along: Revisiting the technical aspects of immunohistochemistry—the red, brown, and blue technique. Vet. Pathol., 51: 42-87.
- McManus, J.F.A., 1948. Histological and histochemical uses of periodic acid. Biotech. Histochem., 23: 99-108.
- Young, L.E.A., L.R. Conroy, H.A. Clarke, T.R. Hawkinson and K.E. Bolton et al., 2022. In situ mass spectrometry imaging reveals heterogeneous glycogen stores in human normal and cancerous tissues. EMBO Mol. Med., 14.
- Skurat, A.V., D.M. Segvich, A.A. dePaoli-Roach and P.J. Roach, 2017. Novel method for detection of glycogen in cells. Glycobiology, 27: 416-424.
- Errico, S., M. Moggio, N. Diano, M. Portaccio and M. Lepore, 2023. Different experimental approaches for Fourier-transform infrared spectroscopy applications in biology and biotechnology: A selected choice of representative results. Biotechnol. Appl. Biochem., 70: 937-961.
- Movasaghi, Z., S. Rehman and Ihtesham ur Rehman, 2008. Fourier transform infrared (FTIR) spectroscopy of biological tissues. Appl. Spectrosc. Rev., 43: 134-179.
- Hackett, M.J., N.J. Sylvain, H. Hou, S. Caine, M. Alaverdashvili, M.J. Pushie and M.E. Kelly, 2016. Concurrent glycogen and lactate imaging with FTIR spectroscopy to spatially localize metabolic parameters of the glial response following brain ischemia. Anal. Chem., 88: 10949-10956.
- Poonprasartporn, A. and K.L.A. Chan, 2022. Label-free study of intracellular glycogen level in metformin and resveratrol-treated insulin-resistant HepG2 by live-cell FTIR spectroscopy. Biosens. Bioelectron., 212.
- Baker, M.J., J. Trevisan, P. Bassan, R. Bhargava and H.J. Butler et al., 2014. Using Fourier transform IR spectroscopy to analyze biological materials. Nat. Protoc., 9: 1771-1791.
- Adeleke, S.T., C. Igbeneghu and S. Iyiola, 2025. Diagnostic performance of ATR-FTIR spectroscopy in discriminating normal breast tissue and breast tumors. Cancer Screening Prev., 4: 79-88.
- Baker, M.J., S.R. Hussain, L. Lovergne, V. Untereiner and C. Hughes et al., 2015. Developing and understanding biofluid vibrational spectroscopy: A critical review. Chem. Soc. Rev., 45: 1803-1818.
- Rienda, I., M. Moreno-Torres, E. Moro, J. Pérez-Rojas and E. Pareja et al., 2024. Assessing ATR-FTIR spectroscopy for steatosis quantification in liver biopsies in a long-duration cross-sectional study. Microchem. J., 198.
- Anty, R., M. Morvan, M. le Corvec, C.M. Canivet and S. Patouraux et al., 2019. The mid-infrared spectroscopy: A novel non-invasive diagnostic tool for NASH diagnosis in severe obesity. JHEP Rep., 1: 361-368.
- Malek, K., B.R. Wood and K.R. Bambery, 2013. FTIR Imaging of Tissues: Techniques and Methods of Analysis. In: Optical Spectroscopy and Computational Methods in Biology and Medicine, Baranska, M. (Ed.), Springer, Netherlands, ISBN: 978-94-007-7832-0, pp: 419-473.
- Al-Kelani, M. and N. Buthelezi, 2024. Advancements in medical research: Exploring Fourier Transform Infrared (FTIR) spectroscopy for tissue, cell, and hair sample analysis. Skin Res. Technol., 30.
- Staniszewska, E., K. Malek and M. Baranska, 2014. Rapid approach to analyze biochemical variation in rat organs by ATR FTIR spectroscopy. Spectrochim. Acta, Part A: Mol. Biomol. Spectrosc., 118: 981-986.
- Movasaghi, Z., S. Rehman and Ihtesham U. Rehman, 2007. Raman spectroscopy of biological tissues. Appl. Spectrosc. Rev., 42: 493-541.
- Chiriboga, L., H. Yee and M. Diem, 2000. Infrared spectroscopy of human cells and tissue. Part VI: A comparative study of histopathology and infrared microspectroscopy of normal, cirrhotic, and cancerous liver tissue. Appl. Spectrosc., 54: 1-8.
- le Naour, F., M.P. Bralet, D. Debois, C. Sandt and C. Guettier et al., 2009. Chemical imaging on liver steatosis using synchrotron infrared and ToF-SIMS microspectroscopies. PLoS ONE, 4.
- Vazquez-Zapien, G.J., M.M. Mata-Miranda, V. Sanchez-Monroy, R.J. Delgado-Macuil, D.G. Perez-Ishiwara and M. Rojas-Lopez, 2016. FTIR spectroscopic and molecular analysis during differentiation of pluripotent stem cells to pancreatic cells. Stem Cells Int., 2016.
- Moggio, M., S. Errico, N. Diano and M. Lepore, 2021. FTIR spectroscopy for evaluation and monitoring of lipid extraction efficiency for murine liver tissues analysis. Eng. Proc., 10.
- Lazaro-Pacheco, D., A. Shaaban, G. Baldwin, N.A. Titiloye, S. Rehman and Ihtesham ur Rehman, 2022. Deciphering the structural and chemical composition of breast cancer using FTIR spectroscopy. Appl. Spectrosc. Rev., 57: 234-248.
- Adt, I., D. Toubas, J.M. Pinon, M. Manfait and G.D. Sockalingum, 2006. FTIR spectroscopy as a potential tool to analyse structural modifications during morphogenesis of Candida albicans. Arch. Microbiol., 185: 277-285.
- Hawkinson, T.R. and R.C. Sun, 2021. Matrix-Assisted Laser Desorption/Ionization Mass Spectrometry Imaging of Glycogen in situ. In: Mass Spectrometry Imaging of Small Molecules: Methods and Protocols, Lee, Y.J. (Ed.), Springer, Humana, New York, ISBN: 978-1-0716-2030-4, pp: 215-228.
- Chen, S., Y. Bouchibti, Y. Xie, Y. Chen, V. Chang and C.B. Lebrilla, 2023. Analysis of cell glycogen with quantitation and determination of branching using liquid chromatography-mass spectrometry. Anal. Chem., 95: 12884-12892.
- Scott, T.L., J. Zhu, T.A. Cassel, S. Vicente-Muñoz and P. Lin et al., 2022. A micro-scale analytical method for determining glycogen turnover by NMR and FTMS. Metabolites, 12.
- Greene, J., J. Louis, O. Korostynska and A. Mason, 2017. State-of-the-art methods for skeletal muscle glycogen analysis in athletes-the need for novel non-invasive techniques. Biosensors, 7.
How to Cite this paper?
APA-7 Style
Adeleke,
S., Avbunufe,
O., Adesope,
E., Igbeneghu,
C. (2026). Glycogen as a Proxy Marker for Non-Alcoholic Fatty Liver Disease: Histochemical and Spectroscopic Insights. Trends in Biological Sciences, 2(4), 347-358. https://doi.org/10.21124/tbs.2026.347.358
ACS Style
Adeleke,
S.; Avbunufe,
O.; Adesope,
E.; Igbeneghu,
C. Glycogen as a Proxy Marker for Non-Alcoholic Fatty Liver Disease: Histochemical and Spectroscopic Insights. Trends Biol. Sci 2026, 2, 347-358. https://doi.org/10.21124/tbs.2026.347.358
AMA Style
Adeleke
S, Avbunufe
O, Adesope
E, Igbeneghu
C. Glycogen as a Proxy Marker for Non-Alcoholic Fatty Liver Disease: Histochemical and Spectroscopic Insights. Trends in Biological Sciences. 2026; 2(4): 347-358. https://doi.org/10.21124/tbs.2026.347.358
Chicago/Turabian Style
Adeleke, Samuel, Oghenedoro Avbunufe, Erioluwa Adesope, and Christopher Igbeneghu.
2026. "Glycogen as a Proxy Marker for Non-Alcoholic Fatty Liver Disease: Histochemical and Spectroscopic Insights" Trends in Biological Sciences 2, no. 4: 347-358. https://doi.org/10.21124/tbs.2026.347.358

This work is licensed under a Creative Commons Attribution 4.0 International License.