
Multi-Trait Phenotypic Selection of Musa spp. (AAA and AAB Genome Groups) for Yield and Nutritional Quality
-
Adesike O. Olayinka


Crop Production and Soil Science Department, Ladoke Akintola University of Technology, PMB 4000, Ogbomoso, Nigeria
Dorcas O. IbitoyeGenetic Resources Unit, National Horticultural Research Institute, PMB. 5432, Ibadan, Nigeria
Abiodun F. OlayinkaUniversity of Ghana, Legon, Accra, Ghana
Olufemi S. AkandeCrop Production and Soil Science Department, Ladoke Akintola University of Technology, PMB 4000, Ogbomoso, Nigeria
Peter A. AdebayoCrop Production and Soil Science Department, Ladoke Akintola University of Technology, PMB 4000, Ogbomoso, Nigeria
Godswill O. UjahCrop Production and Soil Science Department, Ladoke Akintola University of Technology, PMB 4000, Ogbomoso, Nigeria
Oluwakemi O. FatokiCrop Production and Soil Science Department, Ladoke Akintola University of Technology, PMB 4000, Ogbomoso, Nigeria
| Received 11 Jan, 2026 |
Accepted 21 Jul, 2026 |
Published 30 Sep, 2026 |
Background and Objective: Musa spp. (banana, AAA and plantain, AAB) serves as a vital staple crop for food security and income in West Africa, yet it faces breeding challenges due to trait variability and sterility. This study characterized the agronomic, bioactive, mineral, and proximate traits of 10 Musa spp. at the National Horticultural Research Institute (NIHORT) in Ibadan, Nigeria, to identify superior multi-trait genotypes. Materials and Methods: Field trials measured yield components (bunch weight, hands, fruit length), phenology, and suckers. Fruits underwent triplicate analyses for bioactive, mineral, colour, and proximate composition following the Association of Official Analytical Chemists (AOAC) standard methods. All data were analyzed using the R statistical software. Results: The analysis of variance confirmed highly significant phenotypic differences (p<0.001) across traits. ITC1352 SH3764 achieved the highest bunch weight (23.40 kg) and fruit length (11.43 cm). The MOO9 and NHPN052 led to β-carotene (466.00, 452.00 μg/g) and total carotenoids. Correlations showed associations with the yield trait (bunch weight and mid-hand: r = 0.85) and with nutritional trade-offs (moisture vs. carbohydrates: r = -1.00). Principal component analysis explained 90% of total variation across five components, with PC1 and PC2 capturing 62% (PC1: carotenoids, fat, iron vs. moisture, vitamin C; PC2: yield traits vs. flavonoids, pH). Clustering analysis gave three groups: nutrient-rich (MOO9, NHPN052, NHPN054), high-yielding hybrids, and diverse landraces. Genotype by yield×trait analysis ranked ITC1352 SH3764 highest (SI = 1.47), ideal for yield and quality. Conclusion: Multivariate approaches revealed agronomic-nutritional performance, identifying ITC1352 SH3764, NHPN054, and ITC1350 SH3748 as elite parents for resilient, nutrient-dense banana and plantain breeding.
| Copyright © 2026 Olayinka et al. This is an open-access article distributed under the Creative Commons Attribution License, which permits unrestricted use, distribution, and reproduction in any medium, provided the original work is properly cited. |
INTRODUCTION
Banana (Musa spp., AAA and AAB genome groups), a member of the Musaceae family, originated in Southeast Asia as a perennial herbaceous species. It is one of the most important staple and cash crops supporting global food security, nutrition, and rural livelihoods in tropical regions, particularly in Central and West Africa1. In addition to its role as a major source of dietary energy, bananas provide essential nutrients, including complex carbohydrates, dietary fibre, minerals, and vitamins, making both its productivity and quality critical for human health and income generation2. It is used in fried, boiled, roasted, and flour-based products.
Despite its importance, production and utilization are constrained by substantial variability in agronomic traits, bioactive compounds, minerals, and proximate composition arising from differences among cultivars, environments, and management practices, which directly influence yield, processing suitability, and consumer acceptance1. Genetic improvement is further limited by triploid sterility, susceptibility to pests and diseases, vulnerability to climate stress, and trade-offs between yield, resistance, and consumer-preferred quality attributes3-5. Under these constraints, systematic characterization and effective exploitation of existing germplasm remain the most practical and reliable strategy for identifying high-performing and resilient varieties6.
However, most previous studies have evaluated agronomic or nutritional traits in isolation, which restricts understanding of how multiple traits interact to determine overall performance and end-use quality. This fragmented approach limits the identification of cultivars that combine high yield with superior nutritional and processing attributes. Holistic, multi-trait evaluation is therefore essential for evidence-based selection in banana and plantain improvement programmes.
Multivariate statistical methods such as principal component analysis, cluster analysis, correlation analysis, and discriminant function analysis provide a powerful framework for analysing complex, interrelated traits by reducing dimensionality, identifying the major contributors to variation, and grouping genotypes based on multi-trait performance7. In addition, genotype by yield×trait (GYT) biplot analysis offers a robust approach to quantify genetic variability, trait associations, and superior genotypes by reducing dimensionality, identifying key trait contributors to total variance, and ranking accessions based on yield-trait combinations rather than isolated traits8. The GYT biplot, in particular, visualizes genotype performance across yield multiplied by target traits, enabling objective selection of multi-trait superior varieties that prioritize high yield alongside desirable attributes, which is critical for banana and plantain breeding where yield often trades off with quality. By exploiting trait interrelationships often overlooked by univariate approaches, these methods enable more precise identification of superior genotypes for breeding and cultivation9.
Hence, this study integrates agronomic traits, bioactive compounds, minerals, and proximate parameters to comprehensively evaluate Musa spp. germplasm with the objectives of assessing genetic variability, determining trait associations, identifying key drivers of variation, and ranking varieties based on their combined agronomic and nutritional performance.
MATERIALS AND METHODS
Study site: Field trials were conducted from June 2024 to May 2025 at the National Horticultural Research Institute (NIHORT) in Ibadan, Oyo State, Nigeria (7°22 N, 3°54 E), within the humid forest agro-ecological zone of Southwestern Nigeria. This tropical region features bimodal rainfall (1,200-1,500 mm annually), distinct wet (April-October) and dry (November-March) seasons, and sandy loam soils (pH 5.5-6.5) conducive to Musa spp. cultivation.
|
| Table 1: | Genetic materials used in the study | |||
| SN | Genotype | Type | Source |
| 1 | ITC1307 SH3640 | Dessert banana hybrid (AAAB) | NIHORT |
| 2 | ITC1352 SH3764 | Dessert banana hybrid (AAAB) | NIHORT |
| 3 | ITC1350 SH3748 | Dessert banana hybrid (AAAB) | NIHORT |
| 4 | PITA2 | Plantain hybrid (AAB) | NIHORT |
| 5 | PITA3 | Plantain hybrid (AAB) | NIHORT |
| 6 | Cappa plantain/Ipupu | Cooking banana (AAB) | NIHORT |
| 7 | Red omini | Landrace banana (AAA) | NIHORT |
| 8 | MOO9 | Landrace plantain (AAB) | NIHORT |
| 9 | NHPN054 | Landrace plantain (AAB) | NIHORT |
| 10 | NHPN052 | Landrace plantain (AAB) | NIHORT |
| NIHORT: National Horticultural Research Institute | |||
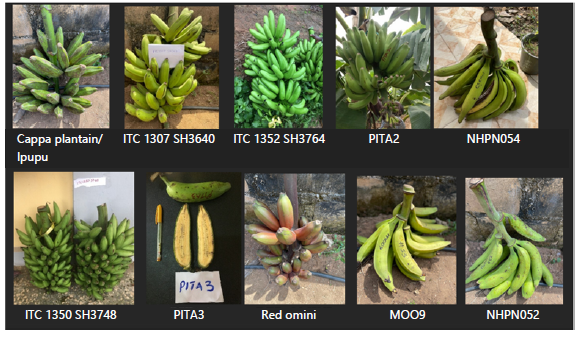
Planting materials: Ten Musa spp. comprising both AAA and AAB genome groups were evaluated, including landraces, hybrids, and dessert banana cultivars from NIHORT’s breeding programme (Table 1, Fig. 1). These genotypes were selected to represent diversity in yield potential, disease resistance, and local adaptability, enabling robust multi-trait assessment under humid tropical conditions.
Data collection: Agronomic traits were measured on field-grown plants. Plant height at flowering was recorded as the distance (cm) from soil level to the angle formed by the bunch stalk and the bunch cover leaf. Days to flowering were defined as the number of days from planting to inflorescence emergence (i.e., appearance of the first floral bract). Days to fruit filling were calculated as the number of days from inflorescence emergence to bunch harvest. Bunch weight (kg) was determined by severing the peduncle above the first hand (at the level of the last scar) and immediately below the last hand. Mid-hand weight (kg), fruit length (cm), and sucker count were also recorded. Four to five healthy, uniformly ripened fruits per genotype and replication were harvested, washed, peeled, sliced, and oven-dried at 60°C. Analyses of bioactive compounds, colour attributes, mineral elements, and proximate composition were conducted in triplicate at the Product Development Laboratory of the National Horticultural Research Institute (NIHORT), Ibadan, Nigeria, following standard procedures of the Association of Official Analytical Chemists10.
The bioactive parameters evaluated included pH, total soluble solids (TSS, °Brix), β-carotene (μg/g), total phenolics (mg 100/g), flavonoids (mg 100/g), vitamin C (mg 100/g), and total carotenoids (μg/g). Fruit colour was quantified using the CIELAB system, comprising L* (lightness), a* (red-green coordinate), and b* (yellow-blue coordinate). Mineral composition was determined for potassium (K), sodium (Na), calcium (Ca), zinc (Zn), and iron (Fe). Proximate analysis included moisture, ash, crude protein, crude fat, crude fibre, and carbohydrate contents, all expressed on a dry-weight basis (g 100/g).
| Table 2: | Mean squares of agronomic traits, bioactive compounds, minerals, and proximate composition of the Musa spp. evaluated | |||
| Source | |||||
| Trait | Genotype df = 9 |
Replication df = 2 |
Error df = 18 |
CV (%) | R2 |
| Agronomic trait | |||||
| Height at flowering (cm) | 0.16*** | 0 | 0.03 | 6.83 | 0.74 |
| Days to flowering | 2394.09*** | 303.7 | 146.18 | 4.54 | 0.89 |
| Days to fruit filling | 2747.11*** | 103.3 | 265.56 | 4.43 | 0.84 |
| Bunch weight (kg) | 77.49*** | 6.83 | 3.21 | 12.26 | 0.93 |
| Number of hands | 47.34*** | 7.6 | 5.3 | 29.15 | 0.82 |
| Weight of mid-hand (kg) | 0.45*** | 0.05 | 0.02 | 7.09 | 0.93 |
| Fruit length (cm) | 7.27*** | 0.31 | 0.2 | 4.3 | 0.95 |
| Number of suckers | 7.96*** | 0.23 | 0.71 | 15.01 | 0.85 |
| Bioactive compound | |||||
| pH | 0.04*** | 0 | 0 | 0.15 | 1 |
| TTS (°Brix) | 39.86*** | 0 | 0.02 | 0.59 | 1 |
| β-Carotene (μg/g) | 4710.13*** | 3.43 | 20.21 | 1.1 | 0.99 |
| Phenolic (mg/100g) | 998.11*** | 40.06 | 26.8 | 2.04 | 0.95 |
| Flavonoid (mg/100g) | 101.20** | 5.5 | 19.04 | 2.99 | 0.73 |
| Vitamin C (mg/100g) | 10.30*** | 0.12 | 0.14 | 1.77 | 0.97 |
| Total carotenoid (μg/g) | 6782.59*** | 4.94 | 29.1 | 1.1 | 0.99 |
| Proximate composition | |||||
| Protein (g/100g) | 0.03*** | 0*** | 0 | 0.47 | 1 |
| Moisture (g/100g) | 119.95*** | 0.61 | 0.61 | 1.17 | 0.99 |
| Ash (g/100g) | 0.26*** | 0 | 0 | 3.83 | 0.98 |
| Fibre (g/100g) | 0.07*** | 0 | 0 | 0.78 | 0.99 |
| Fat (g/100g) | 0.01*** | 0 | 0 | 4.84 | 0.97 |
| Carbohydrate (g/100g) | 113.87*** | 0.49 | 0.61 | 2.79 | 0.99 |
| Mineral composition | |||||
| Potassium | 12139.58*** | 12.66 | 11.4 | 0.95 | 1 |
| Sodium | 1.18*** | 0.01 | 0.02 | 3.93 | 0.98 |
| Calcium | 20.87*** | 0 | 0.02 | 1.55 | 1 |
| Zinc | 0*** | 0 | 0 | 4.97 | 0.79 |
| Iron | 0.07*** | 0 | 0 | 3.85 | 0.98 |
| Colour | |||||
| L* (lightness) | 27.75*** | 0.35 | 0.53 | 1.67 | 0.96 |
| a* (red/green coordinate) | 11.79*** | 0.05 | 0.1 | 2.34 | 0.98 |
| b* (yellow/blue coordinate) | 47.84*** | 0.31 | 0.57 | 1.95 | 0.98 |
| **,***Significant at 0.01 and 0.001, respectively df: Degree of freedom, CV: Coefficient of variation and R2: Coefficient of determination | |||||
Statistical analyses: Data were analyzed using R software (version 4.4.1; R Core Team, 2024). Analysis of Variance (ANOVA) was used to test for genotypic differences, with means separated by Fisher’s least significant difference (LSD) test at a significance level of p<0.05. Pearson correlation coefficients assessed trait associations11. Principal Component Analysis (PCA) identified major sources of variation and key contributors to traits12. Hierarchical cluster analysis used Ward’s method with Euclidean distances to group genotypes. Genotype by yield×trait (GYT) analysis generated yield×trait biplots and Superiority Indices (SI) to rank multi-trait performance8,13,14.
RESULTS
Analysis of variance: The mean squares from Analysis of Variance (ANOVA) revealed highly significant differences (p<0.001) among the Musa spp. evaluated for all agronomic traits, which include height at flowering, days to flowering, days to fruit filling, bunch weight, hands per bunch, mid-hand weight, fruit length, and sucker number (Table 2). The coefficient of determination showed high predictability (R2 = 0.74-0.95) with an acceptable coefficient of variation (CV = 4.30-29.15%).
| Table 3: | Mean performance of agronomic traits, bioactive compounds, minerals, and proximate composition of the Musa spp. evaluated | |||
| Genotype Cappa/Ipupu plantain |
ITC1307 SH3640 | ITC1350 SH3748 | ITC1352 SH3764 | MOO9 | NHPN052 | NHPN054 | PITA2 | PITA3 | Red Omini | LSD (0.05) | |
| Agronomic trait | |||||||||||
| Height at flowering (cm) | 2.66 | 2.49 | 2.56 | 2.54 | 1.85 | 2.5 | 2.62 | 2.37 | 2.38 | 2.54 | 0.3 |
| Days to flowering | 245.33 | 335.67 | 241.67 | 252.67 | 250.33 | 251.67 | 257.67 | 287 | 279 | 264 | 20.74 |
| Days to fruit filling | 348 | 442.67 | 346.67 | 365.33 | 366.33 | 328.33 | 361 | 373 | 380.33 | 369.33 | 27.95 |
| Bunch weight (kg) | 10.57 | 14.17 | 18.93 | 23.4 | 16.63 | 15.57 | 19.33 | 8.53 | 8.13 | 10.9 | 3.07 |
| Number of hands | 7.33 | 7.67 | 15.67 | 14.67 | 5 | 5 | 7 | 5.67 | 4.67 | 6.33 | 3.95 |
| Weight of mid-hand (kg) | 1.43 | 1.68 | 2.37 | 2.47 | 1.73 | 1.8 | 2 | 1.6 | 1.63 | 1.23 | 0.24 |
| Fruit length (cm) | 10.93 | 12.83 | 11.23 | 11.43 | 10.53 | 10.47 | 10.5 | 8.17 | 9.37 | 7.6 | 0.77 |
| Number of suckers | 4.67 | 8.33 | 7 | 8 | 5.67 | 4.67 | 4.67 | 4.67 | 5.33 | 3.33 | 1.45 |
| Bioactive compound | |||||||||||
| pH | 5.97 | 5.73 | 5.71 | 5.75 | 5.61 | 5.63 | 5.66 | 5.74 | 5.78 | 5.87 | 0 |
| TTS (°Brix) | 16 | 24.1 | 24 | 15.1 | 21.2 | 23.6 | 22.6 | 25.1 | 25.7 | 21.03 | 0.24 |
| β-Carotene (μg/g) | 339.67 | 378.67 | 392.67 | 384.67 | 466 | 452 | 455.67 | 406 | 399.67 | 394.33 | 7.71 |
| Phenolic (mg/100g) | 278.39 | 247.27 | 223.02 | 268.79 | 257.96 | 256.77 | 240.62 | 279 | 235.34 | 254.52 | 8.88 |
| Flavonoid (mg/100g) | 154.66 | 137.37 | 139.39 | 149.33 | 143.31 | 142.65 | 150.39 | 152.31 | 147.09 | 141.4 | 7.49 |
| Vitamin C (mg/100g) | 22.36 | 23.09 | 22.8 | 21.76 | 18.14 | 18.27 | 19.35 | 20.59 | 22.5 | 21.35 | 0.64 |
| Total carotenoid (μg/g) | 407.6 | 454.4 | 471.2 | 461.6 | 559.2 | 542.4 | 546.8 | 487.2 | 479.6 | 473.2 | 9.25 |
| Proximate composition | |||||||||||
| Protein (g/100g) | 1.12 | 1.31 | 1.36 | 1.15 | 1.24 | 1.25 | 1.28 | 1.28 | 1.26 | 1.48 | 0 |
| Moisture (g/100g) | 70.58 | 70.38 | 72.26 | 74.01 | 59.47 | 57.48 | 59.71 | 63.39 | 66.62 | 73.76 | 1.34 |
| Ash (g/100g) | 1.08 | 0.98 | 1.04 | 1.04 | 1.75 | 1.44 | 1.81 | 1.28 | 1.25 | 1.18 | 0 |
| Fibre (g/100g) | 2.47 | 2.61 | 2.49 | 2.63 | 2.23 | 2.27 | 2.26 | 2.59 | 2.55 | 2.59 | 0 |
| Fat (g/100g) | 0.22 | 0.27 | 0.25 | 0.24 | 0.41 | 0.38 | 0.38 | 0.29 | 0.22 | 0.27 | 0 |
| Carbohydrate (g/100g) | 24.54 | 24.44 | 22.6 | 20.93 | 34.91 | 37.17 | 34.56 | 31.16 | 28.1 | 20.72 | 1.34 |
| Mineral composition | |||||||||||
| Potassium | 300 | 302.5 | 305.67 | 400 | 370.83 | 484.33 | 403 | 345 | 356 | 272.5 | 5.79 |
| Sodium | 3 | 2.9 | 2.78 | 2.97 | 3 | 3.9 | 3.09 | 4.1 | 3.63 | 1.9 | 0.24 |
| Calcium | 5 | 10.1 | 8.8 | 6 | 8.1 | 13.9 | 9.68 | 7 | 6.44 | 6.1 | 0.24 |
| Zinc | 0.15 | 0.14 | 0.16 | 0.16 | 0.14 | 0.13 | 0.12 | 0.14 | 0.13 | 0.15 | 0 |
| Iron | 0.22 | 0.29 | 0.29 | 0.25 | 0.58 | 0.56 | 0.57 | 0.27 | 0.24 | 0.27 | 0 |
| Colour | |||||||||||
| L* (lightness) | 36 | 44.71 | 46.4 | 42.48 | 44.16 | 44.25 | 45.77 | 45.29 | 43.88 | 40.9 | 1.25 |
| a* (red/green coordinate) | 10.74 | 12 | 12.75 | 11.53 | 15.36 | 16.68 | 15.83 | 14.59 | 13.9 | 12.6 | 0.54 |
| b* (yellow/blue coordinate) | 35.44 | 33.87 | 34.19 | 35.54 | 43.72 | 43.36 | 43.95 | 40.45 | 39.68 | 37.82 | 1.3 |
Bioactive compounds exhibited highly significant genotypic effects (p<0.001) for pH, TSS (°Brix), β-carotene, phenolics, vitamin C, and total carotenoids, with flavonoids significant at p<0.01 (R2 = 0.73-1.00). Proximate composition displayed highly significant differences (p<0.001) across all parameters (protein, moisture, ash, fiber, fat, carbohydrates), with excellent model fit (R2 = 0.97-1.00; CV <5%). Colour coordinates (L*, a*, b*) and minerals (K, Na, Ca, Zn, Fe) also varied significantly (p<0.001; R2 = 0.79-1.00), confirming substantial genotypic diversity.
Mean performance: Among agronomic traits, ITC1352 SH3764 recorded the highest bunch weight (23.40 kg) and fruit length (11.43 cm), while PITA3 had the lowest bunch weight (8.13 kg) (Table 3). Cappa/Ipupu exhibited maximum height at flowering (2.66 m), contrasting with MOO9 (1.85 m). ITC1307 SH3640 showed the longest days to flowering (335.67 days) and fruit filling (442.67 days), whereas
|
|
|
| Table 4: | Eigenvalues, variability, and factor loadings of principal components for agronomic traits, bioactive compounds, minerals, and proximate composition of Musa spp. evaluated | |||
| Traits | PC1 | PC2 | PC3 | PC4 | PC5 |
| Height at flowering (cm) | -0.13 | -0.01 | -0.07 | 0 | -0.41 |
| Days to flowering | -0.05 | -0.03 | 0.38 | 0.33 | 0.17 |
| Days to fruit filling | -0.09 | -0.08 | 0.33 | 0.24 | 0.35 |
| Bunch weight (kg) | 0.04 | -0.36 | -0.25 | -0.09 | 0.09 |
| Number of hands | -0.14 | -0.32 | -0.19 | -0.12 | -0.16 |
| Weight of mid-hand (kg) | 0.01 | -0.38 | -0.21 | 0.04 | -0.2 |
| Fruit length (cm) | -0.03 | -0.32 | -0.1 | 0.26 | 0.23 |
| Number of suckers | -0.09 | -0.37 | 0 | 0.26 | 0.16 |
| Protein (g/100g) | 0 | -0.03 | 0.35 | -0.43 | -0.08 |
| Moisture (g/100g) | -0.26 | -0.07 | 0 | -0.14 | 0.02 |
| Ash (g/100g) | 0.25 | 0.07 | -0.06 | -0.09 | 0.12 |
| Fibre (g/100g) | -0.23 | 0 | 0.14 | 0.1 | -0.11 |
| Fat (g/100g) | 0.26 | -0.04 | -0.02 | -0.08 | 0.22 |
| Carbohydrate (g/100g) | 0.26 | 0.07 | -0.01 | 0.15 | -0.02 |
| pH | -0.22 | 0.25 | -0.05 | -0.05 | -0.02 |
| Total soluble solids (TSS) | 0.11 | -0.03 | 0.4 | 0.04 | -0.29 |
| β-carotene | 0.26 | -0.07 | 0.02 | -0.11 | 0.05 |
| Phenols | -0.03 | 0.25 | -0.22 | 0.23 | 0.22 |
| Flavonoids | -0.01 | 0.26 | -0.29 | 0.22 | -0.16 |
| Vitamin C | -0.25 | -0.07 | 0.12 | 0.08 | -0.13 |
| Total carotene | 0.26 | -0.07 | 0.02 | -0.11 | 0.05 |
| Lightness (L*) | 0.14 | -0.27 | 0.22 | 0.02 | -0.21 |
| Red/Green coordinate (a*) | 0.27 | 0.02 | 0.06 | -0.01 | -0.15 |
| Yellow/Blue coordinate (b*) | 0.26 | 0.14 | -0.03 | -0.03 | -0.01 |
| Potassium | 0.2 | -0.08 | -0.19 | 0.19 | -0.17 |
| Sodium | 0.12 | 0.06 | -0.02 | 0.46 | -0.34 |
| Calcium | 0.18 | -0.19 | 0.1 | 0.07 | -0.11 |
| Zinc | -0.2 | -0.11 | -0.15 | -0.18 | 0.07 |
| Iron | 0.26 | -0.07 | -0.06 | -0.08 | 0.16 |
| Eigenvalue | 13.05 | 4.86 | 3.99 | 2.46 | 1.63 |
| Proportion (%) | 45 | 17 | 14 | 8 | 6 |
| Cumulative (%) | 45 | 62 | 76 | 84 | 90 |
| PC: Principal component and Bolded values contributed higher to variation | |||||
ITC1350 SH3748 flowered earliest (241.67 days) and NHPN052 had the shortest fruit fill (328.33 days). The highest number of hands per bunch was observed in ITC1350 SH3748 (15.67), and the lowest was in PITA3 (4.67). ITC1307 SH3640 had the highest number of suckers, followed closely by ITC1352 SH3764.
Bioactive compounds varied as PITA3 achieved the highest TSS (25.70 °Brix) and ITC1350 SH3748 maximum lightness (L* = 46.40). NHPN052 excelled in minerals, with peak potassium (484.33 mg/kg), sodium (3.90 mg/kg), and calcium (13.90 mg/kg). Nutritionally, MOO9 and NHPN052 led β-carotene (466.00 and 452.00 μg/g) and total carotenoids. Moisture ranged from 74.01 g/100 g (ITC1352 SH3764) to 57.48 g/100 g (NHPN052), while carbohydrates peaked in NHPN052 (37.17 g/100 g) and MOO9 (34.91 g/100 g). Protein ranged from 1.12-1.48 g/100 g, and phenolics reached 279.00 mg/100 g in PITA2 versus 223.02 mg/100 g in ITC1350 SH3748.
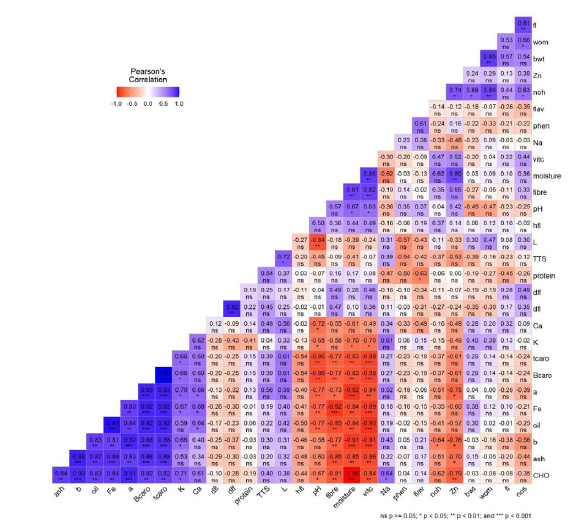
Trait associations: Pearson correlation coefficients revealed significant linear relationships among traits (Fig. 2). Agronomic traits displayed a strong positive linkage between days to flowering and bunch filling (r = 0.92, p<0.001). Bunch weight positively associated with mid-hand weight (r = 0.85, p<0.01) and hands per bunch (r = 0.68, p<0.05); fruit length was strongly associated with sucker number (r = 0.81, p<0.01).
| Table 5: | Standardized GYT and mean Superiority Index of agronomic, proximate, and bioactive compounds of the evaluated Musa spp. | |||
β-Carotene exhibited perfect positive correlation with total carotenoids (r = 1.00, p<0.001) and strong positive association with oil content (r = 0.92, p<0.001), but strong negative correlation with pH (r = -0.86, p<0.01). Moisture positively associated with vitamin C (r = 0.85, p<0.01) and fiber (r = 0.81, p<0.01), yet strongly negatively correlated with carbohydrates (r = -1.00, p<0.001), ash (r = -0.85, p<0.01), oil (r = -0.84, p<0.01), and iron (r = -0.84, p<0.01). Oil strongly positively correlated with iron (r = 0.97, p<0.001) and negatively with vitamin C (r = -0.93, p<0.001). (r = -0.84, p<0.001). TSS moderately positively correlated with L* (r = 0.72, p<0.05).
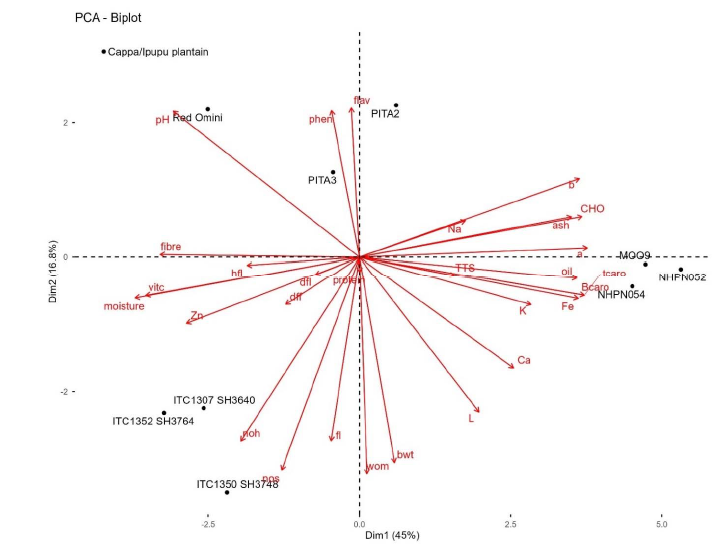
Principal component analysis: The first five principal components (PC) accounted for 90% of total variation, with PC1 (45%) and PC2 (17%) explaining 62% (Table 4, Fig. 3). The PC1 (Eigenvalue 13.05) contrasted nutritional quality traits with moisture: positive loadings for fat (0.26), carbohydrates (0.26), β-carotene (0.26), total carotenoids (0.26), iron (0.26), a* (0.27), b* (0.26), ash (0.25); negative for moisture (-0.26), vitamin C (-0.25), pH (-0.22), fiber (-0.23), zinc (-0.20). The PC2 (Eigenvalue 4.86) separated yield traits from bioactive properties: strong negative loadings for mid-hand weight (-0.38), suckers (-0.37), bunch weight (-0.36), fruit length (-0.32), hands (-0.32), L* (-0.27); positive for flavonoids (0.26), pH (0.25), phenols (0.25). PC3 to PC5 captured phenology (days to flowering/filling: 0.33-0.38 in PC3), sodium (0.46 in PC4), and height in PC5 (-0.41).
The PCA biplot revealed four genotype clusters (Fig. 3): upper left (Cappa/Ipupu, Red Omini, PITA3); lower left (ITC1307 SH3640, ITC1352 SH3764, ITC1350 SH3748); lower right (NHPN052, NHPN054, MOO9); upper right (PITA2).
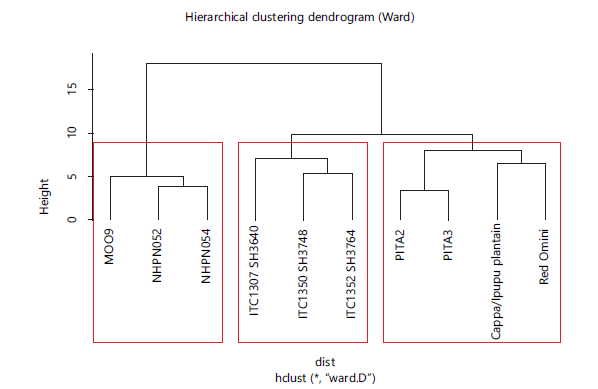
Hierarchical cluster analysis: Hierarchical clustering (Ward’s method, Euclidean distance) grouped the 10 Musa spp. into three distinct clusters based on combined agronomic, bioactive compounds, and proximate traits (Fig. 4). Cluster I (n = 3): MOO9, NHPN052, NHPN054 is characterized by high nutritional
content (e.g., β-carotene, carotenoids). Cluster II (n = 3): ITC1307 SH3640, ITC1350 SH3748, ITC1352 SH3764 is dominated by hybrid genotypes with intermediate yield traits. Cluster III (n = 4): PITA2, PITA3, Cappa/Ipupu, Red Omini is the largest group featuring landraces with diverse bioactive compounds profiles.
Genotype by yield×trait (GYT) and Superiority index (SI): Standardized GYT biplot analysis identified superior multi-trait genotypes via superiority indices (SI) (Table 5). ITC1352 SH3764 ranked highest (SI = 1.47), followed by NHPN054 (SI = 0.97), ITC1350 SH3748 (SI = 0.81), MOO9 (SI = 0.42), and NHPN052 (SI = 0.26). Inferior genotypes showed negative SI: ITC1307 SH3640 (SI = -0.13), Red Omini (SI = -0.77), Cappa/Ipupu (SI = -0.82), PITA2 (SI = -1.06), PITA3 (SI = -1.16). ITC1352 SH3764 excelled in yield×suckers, yield×number of hands, and yield×fiber. NHPN054 performed strongly in yield×ash and yield×carbohydrates.
DISCUSSION
Significant variation observed among the ten Musa spp. (AAA and AAB genome groups) for agronomic traits, bioactive compounds, mineral elements, and proximate composition demonstrate a high level of genetic and phenotypic diversity within the Musa spp. germplasm. This agrees with earlier reports that plantain and banana collections exhibit wide variability in yield components and nutritional attributes, reflecting their complex hybrid origin and long history of farmer selection1,6. The generally low coefficients of variation for bioactive traits (CV <5%) further indicate good experimental precision and enhance confidence in the reliability of the bioactive compound measurements.
Despite these genotypic differences, carbohydrates consistently constituted the dominant proximate component, while potassium was the most abundant mineral across all genotypes. This pattern is typical of plantain and banana fruits, which are widely recognized as energy-rich staples and important dietary sources of potassium1,15. Similar compositional trends have been reported in plantain accessions from West and Central Africa, reinforcing the nutritional role of Musa as a carbohydrate-based staple with significant mineral contribution.
Marked differences in genotype performance were evident for both agronomic and nutritional traits. ITC1352 SH3764 exhibited superior bunch weight and fruit length, confirming the yield advantage commonly associated with improved dessert banana hybrid developed through structured breeding programmes7,16. In contrast, landraces such as MOO9 and NHPN052 showed outstanding concentrations of β-carotene and total carotenoids, highlighting their potential as biofortified sources of provitamin A. Similar genotype-dependent variation in carotenoid content has been documented in African plantain germplasm and attributed to genetic differences in carotenoid biosynthesis and fruit pigmentation6,15. This contrast between high-yielding hybrids and nutritionally superior landraces underscores the importance of conserving diverse Musa germplasm for both productivity and nutritional improvement.
Correlation analysis revealed strong positive associations among yield components, particularly between bunch weight, mid-hand weight, and number of hands per bunch, indicating that these traits contribute synergistically to total yield. Comparable relationships have been reported in plantain and banana, suggesting that indirect selection for one component can enhance overall bunch yield6,7. Conversely, the strong negative correlations between vitamin C and carotenoids, and between moisture and carbohydrate content, suggest physiological trade-offs in fruit composition, likely reflecting competition among metabolic pathways during ripening and dry-matter accumulation. Such trade-offs have also been observed in other Musa studies and emphasize the need for multi-trait selection strategies rather than single-trait optimization.
Multivariate analyses further clarified the structure of variation among the genotypes. The first two principal components explained 62% of the total variability, with PC1 largely separating genotypes based on dry matter, carotenoids, fat, and iron versus moisture and vitamin C, while PC2 differentiated yield-related traits from flavonoids and pH. Similar patterns of trait partitioning have been reported in Musa germplasm evaluations, where agronomic and nutritional traits often segregate independently7,17. The PCA biplot clearly separated high-yielding ITC hybrids from nutritionally dense landraces, confirming that superior productivity does not necessarily coincide with superior nutritional quality.
Hierarchical clustering supported the PCA results by grouping the genotypes into three functional clusters: nutritionally rich landraces, high-yielding hybrids, and a diverse group of intermediate accessions. This clustering pattern is consistent with earlier classifications of plantain germplasm and provides a practical framework for parent selection in breeding programs aimed at combining yield and nutritional quality through heterosis16,17.
The genotype by yield×trait (GYT) biplot offered a more integrative evaluation by simultaneously considering yield and quality attributes. ITC1352 SH3764 ranked highest due to its strong performance across multiple yield-based trait combinations, confirming the breeding advantage of improved hybrids for commercial production. Similar dominance of hybrids in multi-trait selection indices has been reported in plantain and other vegetatively propagated crops14,18. However, the relatively lower ranking of landraces does not diminish their value, as their superior carotenoid and mineral contents make them indispensable donors for nutritional enhancement in future breeding efforts.
The observed divergence between agronomic and nutritional performance reinforces the need for complementary breeding strategies that combine high-yielding hybrids with nutrient-dense landraces to develop Musa spp. capable of meeting both production and nutritional security goals in Sub-Saharan Africa.
CONCLUSION
This study demonstrates substantial genetic diversity among 10 Musa spp. for agronomic traits, bioactive compounds, minerals, and proximate composition, with ITC1352 SH3764 emerging as the superior genotype (SI = 1.47). Multivariate approaches, PCA (62% variation explained), clustering, and correlations reveal yield-nutritional performance, identifying trade-offs (e.g., moisture vs. carbohydrates: r = -1.00) and selection opportunities (bunch weight and mid-hand: r = 0.85). Elite banana hybrid (AAAB) viz. ITC1352 SH3764, NHPN054, and ITC1350 SH3748 integrate high yield with quality traits, serving as prime candidates for NIHORT’s breeding programme targeting resilient, nutrient-dense bananas. These findings provide a robust framework for multi-trait selection, advancing food security and commercialization in West Africa’s humid tropics.
SIGNIFICANCE STATEMENT
The present study revealed highly significant genotypic variation (p<0.001) among Musa spp. for agronomic, nutritional, and bioactive traits, confirming strong genetic diversity and trait stability. This significance underscores the reliability of detected differences, supports effective multi-trait selection, and validates the potential of identified superior genotypes for yield improvement and nutritional enhancement in banana and plantain breeding programs.
ACKNOWLEDGMENT
The authors gratefully acknowledge the Genetic Resources Unit of the National Horticultural Research Institute (NIHORT), Ibadan, Nigeria, for providing the genetic materials used in this study. We also appreciate the project students, under the supervision of the first author, from the Department of Crop Production and Soil Science, Faculty of Agricultural Sciences, Ladoke Akintola University of Technology, Ogbomoso, Nigeria, for their invaluable technical support.
REFERENCES
- Udomkun, P., C. Masso, R. Swennen, B. Innawong, A. Alakonya, A.F. Kuate and B. Vanlauwe, 2021. How does cultivar, maturation, and pre-treatment affect nutritional, physicochemical, and pasting properties of plantain flours? Foods, 10.
- Arora, M., P. Rasane, J. Singh, S. Kaur, M. Bakshi and J. Kaur, 2022. Reinventing plantain as a functional food: A processing based approach. Curr. Nutr. Food Sci., 18: 752-764.
- Amah, D., E. Stuart, D. Mignouna, R. Swennen and B. Teeken, 2021. End-user preferences for plantain food products in Nigeria and implications for genetic improvement. Int. J. Food Sci. Technol., 56: 1148-1159.
- Pillay, M., A. Tenkouano and J. Hartman, 2002. Bananas and Plantains: Future Challenges in Musa Breeding. In: Crop Improvement: Challenges in the Twenty-First Century, Kang, M.S. (Ed.), CRC Press, Boca Raton, Florida, ISBN: 9781003578512, pp: 223-252.
- Tripathi, J.N., V.O. Ntui and L. Tripathi, 2024. Precision genetics tools for genetic improvement of banana. Plant Genome, 17. https://doi.org/10.1002/tpg2.20416
- Brisibe, E.A. and G.M. Ubi, 2020. Microsatellite fingerprinting and analysis of intra-population divergence in morphotaxonomic traits in a large Musa (AAB genome) germplasm. Physiol. Mol. Biol. Plants, 26: 1973-1988.
- Amoutchi, A.I., O. N’nan-Alla and D.E.F. Thiemele, 2020. Agro-morphological diversity of plantain accessions from different part of the world. Int. J. Bio. Chem. Sci., 14: 1308-1321.
- Yan, W. and J. Frégeau-Reid, 2018. Genotype by yield*trait (GYT) biplot: A novel approach for genotype selection based on multiple traits. Sci. Rep., 8.
- Eynizadeh, P., H. Dehghani and A. Dehghani, 2023. A novel selection model based on multivariate methods and arbitrary genetic parameters: A case study on tomato families. Plant Methods, 19.
- Prasad, N.N., M. Siddalingaswamy, P.M. Parameswariah, K. Radhakrishna, R.V. Rao, K.R. Viswanathan and K. Santhanam, 2000. Proximate and mineral composition of some processed traditional and popular Indian dishes. Food Chem., 68: 87-94.
- Bueno, R.D., L.L. Borges, P.I.V.G. God, N.D. Piovesan, A.I. Teixeira, C.D. Cruz and E.G. de Barros, 2018. Quantification of anti-nutritional factors and their correlations with protein and oil in soybeans. Anais Acad. Bras. Ciênc., 90: 205-217.
- Nowicka, P., A. Wojdyło and P. Laskowski, 2019. Principal component analysis (PCA) of physicochemical compounds’ content in different cultivars of peach fruits, including qualification and quantification of sugars and organic acids by HPLC. Eur. Food Res. Technol., 245: 929-938.
- Olivoto, T. and A.D.C. Lúcio, 2020. metan: An R package for multi-environment trial analysis. Methods Ecol. E, 11: 783-789.
- Gholizadeh, A. and M. Ghaffari, 2023. Genotype by yield* trait (GYT) biplot analysis: A novel approach for phenotyping sunflower single cross hybrids based on multiple traits. Food Sci. Nutr., 11: 5928-5937.
- Pérez-Donado, C.E., F. Pérez-Muñoz and R.N. Chávez-Jáuregui, 2023. Nutritional composition and in vitro digestibility of two plantain cultivars (Musa paradisiaca spp.) in Puerto Rico. Heliyon, 9.
- Ara, N., M. Moniruzzaman, R. Khatoon and M. Moniruzzaman, 2018. Evaluation of plantain genotypes for yield and other characters. Bangladesh J. Agric. Res., 43: 71-80.
- Pereira, V.M., C.V. Borges, L.P. Brandão, L.S. Oliveira and C.P.F. Souza et al., 2012. Genetic diversity between improved banana diploids using canonical variables and the Ward-MLM method. Pesqui. Agropecu. Bras., 47: 1480-1488.
- Batte, M., B. Uwimana, R. Swennen, A. Brown, H.P. Hovmalm, M. Geleta and R. Ortiz, 2019. Heterobeltiosis in banana and genetic gains through crossbreeding. Proceedings, 36.
How to Cite this paper?
APA-7 Style
Olayinka,
A.O., Ibitoye,
D.O., Olayinka,
A.F., Akande,
O.S., Adebayo,
P.A., Ujah,
G.O., Fatoki,
O.O. (2026). Multi-Trait Phenotypic Selection of Musa spp. (AAA and AAB Genome Groups) for Yield and Nutritional Quality. Trends in Biological Sciences, 2(3), 324-335. https://doi.org/10.21124/tbs.2026.324.335
ACS Style
Olayinka,
A.O.; Ibitoye,
D.O.; Olayinka,
A.F.; Akande,
O.S.; Adebayo,
P.A.; Ujah,
G.O.; Fatoki,
O.O. Multi-Trait Phenotypic Selection of Musa spp. (AAA and AAB Genome Groups) for Yield and Nutritional Quality. Trends Biol. Sci 2026, 2, 324-335. https://doi.org/10.21124/tbs.2026.324.335
AMA Style
Olayinka
AO, Ibitoye
DO, Olayinka
AF, Akande
OS, Adebayo
PA, Ujah
GO, Fatoki
OO. Multi-Trait Phenotypic Selection of Musa spp. (AAA and AAB Genome Groups) for Yield and Nutritional Quality. Trends in Biological Sciences. 2026; 2(3): 324-335. https://doi.org/10.21124/tbs.2026.324.335
Chicago/Turabian Style
Olayinka, Adesike, O., Dorcas O. Ibitoye, Abiodun F. Olayinka, Olufemi S. Akande, Peter A. Adebayo, Godswill O. Ujah, and Oluwakemi O. Fatoki.
2026. "Multi-Trait Phenotypic Selection of Musa spp. (AAA and AAB Genome Groups) for Yield and Nutritional Quality" Trends in Biological Sciences 2, no. 3: 324-335. https://doi.org/10.21124/tbs.2026.324.335

This work is licensed under a Creative Commons Attribution 4.0 International License.